Category | Possible Status Levels |
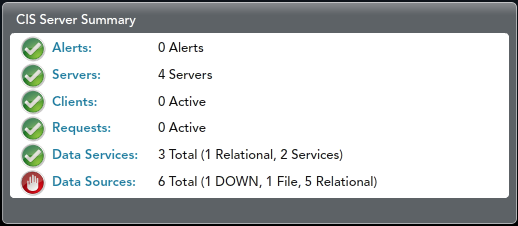
Alerts | OK—No alerts exist. WARNING—General alert. May require attention (like the daemon being inaccessible). ERROR—Critical alert. Probably requires immediate attention (like the TDV or Monitor Server being inaccessible). |
Servers | OK—All servers are running. ERROR—At least one server is inaccessible. |
Clients | OK—Clients always display as OK. |
Requests | Based on the last five minutes of request activity: OK—No errors in the last five minutes. WARNING—A request was terminated in the last five minutes. ERROR—A request failed in the last five minutes. |
Data Services | OK—Data services always display as OK. |
Data Sources | OK—The data source is UP or NOT_TESTED. DISABLED—The data source is DISABLED. ERROR—At least one data source is DOWN. |