Generating and Displaying a SQL Execution Plan
The SQL execution plan shows how TDV plans to execute a SQL query, both on the overall (request) level and on the level of each query node. Execution plan information can help you enhance query performance.
Note: Execution plan and query plan refer to the same thing.
You can display an execution plan in one of two ways:
• For the current query, you can show the execution plan in Studio Modeler.
• For any past query, you can show the query plan in Studio Manager.
By default, Studio opens in the Modeler, the top vertical tab on the left side of the Studio window. To open Studio Manager, click the middle vertical tab.
To display the SQL execution plan in Studio Modeler
1. Open a query in Studio Modeler.
2. Click Show Execution Plan on the editor toolbar.
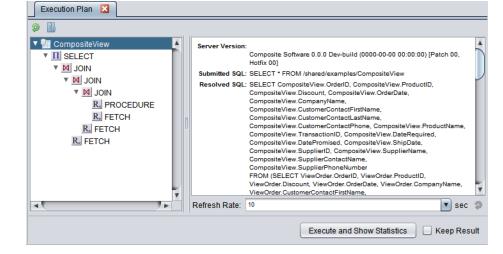
The following example shows the execution plan panels for CompositeView.
3. Highlight the view name in the Tree Panel to see details for the overall query in the Details Panel.
4. Highlight a node (SELECT, one of the JOINs, and so on in this example) in the Tree Panel to see details for that node in the Details Panel.
To display the SQL execution plan in Studio Manager
1. Open Studio Manager by clicking the middle vertical tab along the left side of the Studio window.
2. Select Requests in the navigation pane on the left.
3. Select an SQL query from the list in the Name column.
When you select a query, the Cancel and Show Query Plan buttons become available.
You can expand the Name column to show the first 50 characters of each query text to help identify the query of interest.
4. Click Show Query Plan near the center of the window.

