TIBCO® Graph Database
Spotfire Visualization & Analytics
User Guide
Version 3.1
November 2021
Table of Contents
TGDB Network Visualizer Spotfire Mod
Using TGDB Network Visualizer Mod
How to open the TGDB Network Visualizer Mod
Setting up the TGDB Network Visualizer
Configure TGDB Network Visualizer Mod
How to change Graph, Node and Edge Properties
How to launch the Mod pop out?
Different Properties Supported by a Mod Popout
TIBCO Graph Database Gremlin Query Data Function
Using TGDB Gremlin Query Data Function
Executing a Parameterized Query
Using Graph Analytics in Spotfire
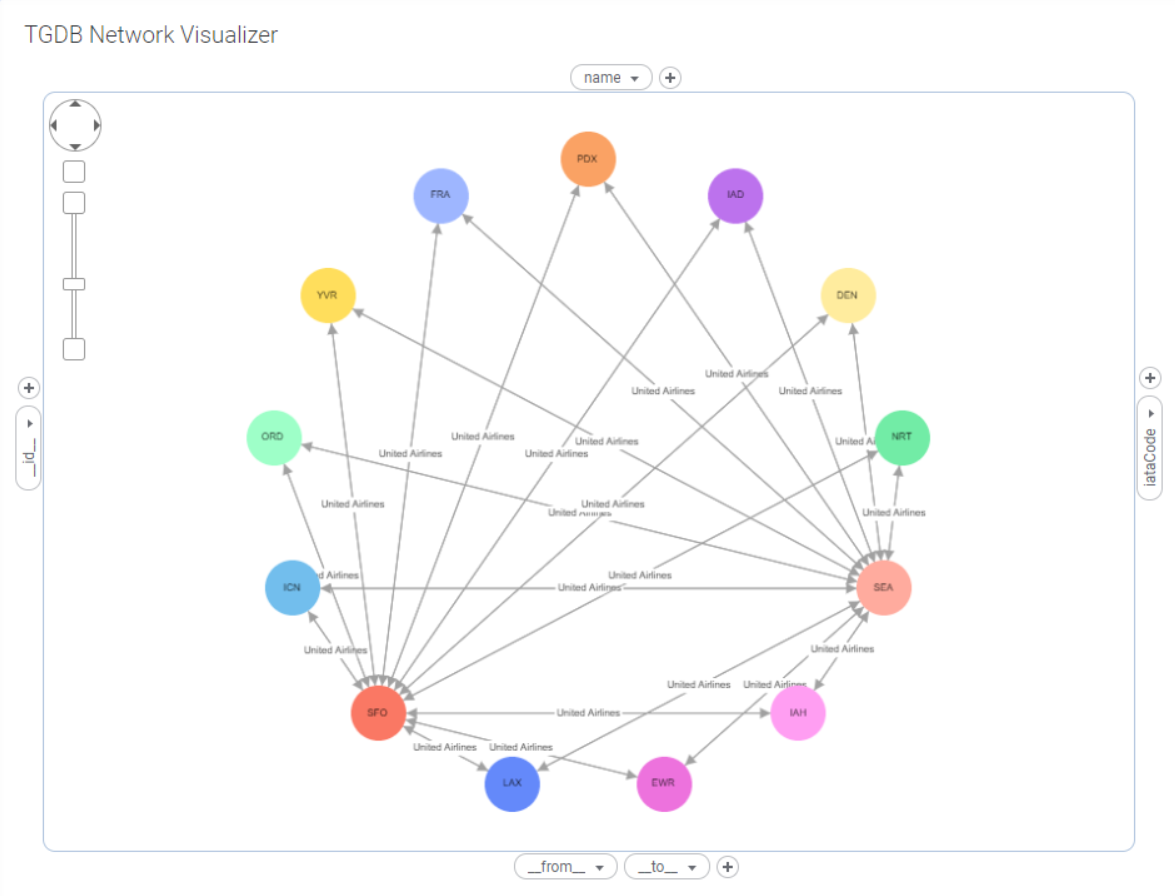
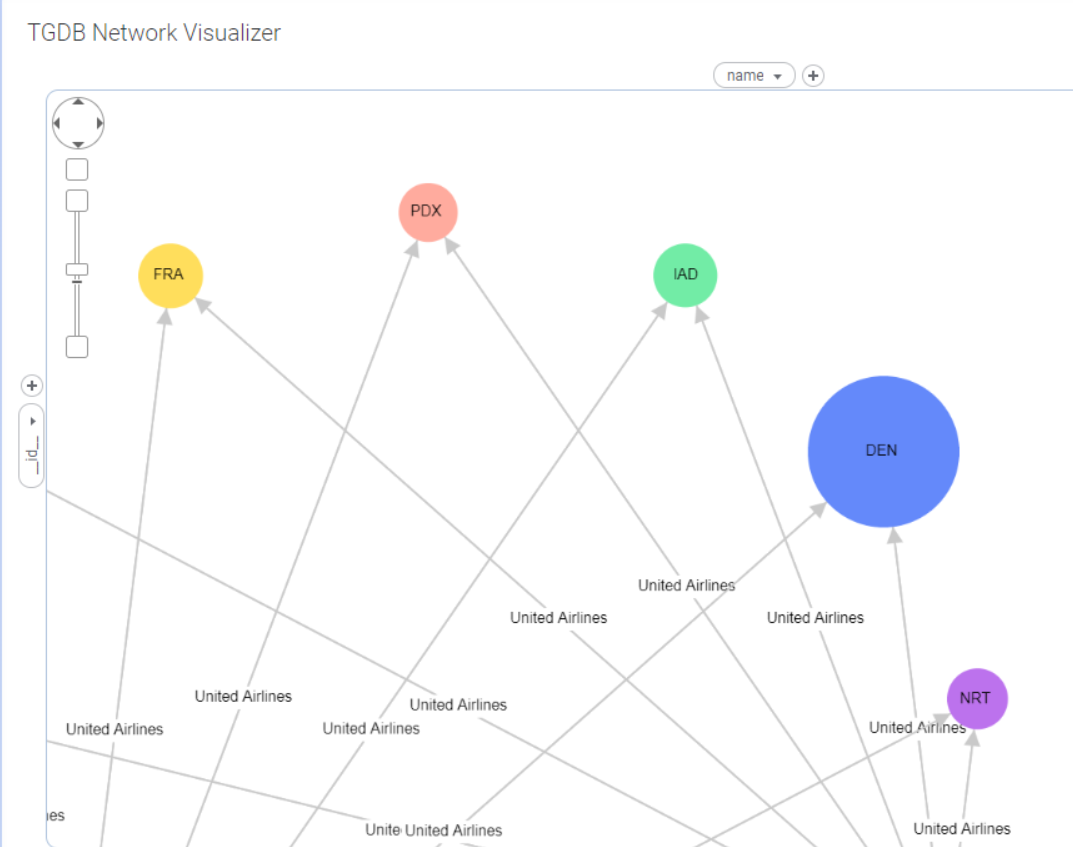
The TIBCO Graph Database Network Visualizer Spotfire mod built using cytoscape.js visualizes relationships and connections between data. It provides an interactive and configurable way to display data consisting of complex relationships. Graph layouts, Panning and Zooming capabilities make it easier to perform in-depth analysis of relationships. It enables users to use native Spotfire data tables as input and to visualize and analyze the data as a Graph/Network.
Operating System : Windows 10
Visualization Tool : TIBCO Spotfire Desktop version 11.5.0+
The TGDB Network Visualizer mod is now added into the analysis and it will prompt a dialog to Trust the Mod. Click on the Trust button and continue. Users should then be able to see the TGDB Network Visualizer Mod loaded in Spotfire Desktop.
In this example dataset, we have 5 columns FromAirport, toAirport, Airline, Cost, Description:
fromAirport | toAirport | Airline | Cost | Description |
Seattle | 0 | Seattle International Airport | ||
Paris | 0 | Paris International Airport | ||
Seattle | Paris | U234 | 1000 | 4 AM flight to Paris |
Dallas | Paris | U345 | 1200 | 6 AM flight to Paris |
Dallas | 0 | Dallas International Airport |
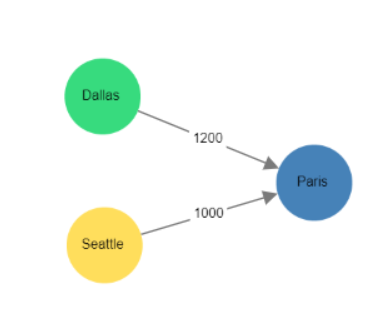
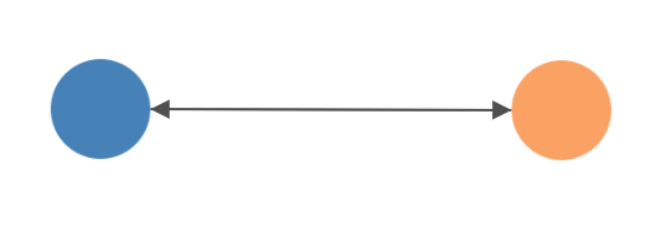
Source and Target columns determine the nodes and edges of your graph visualization.
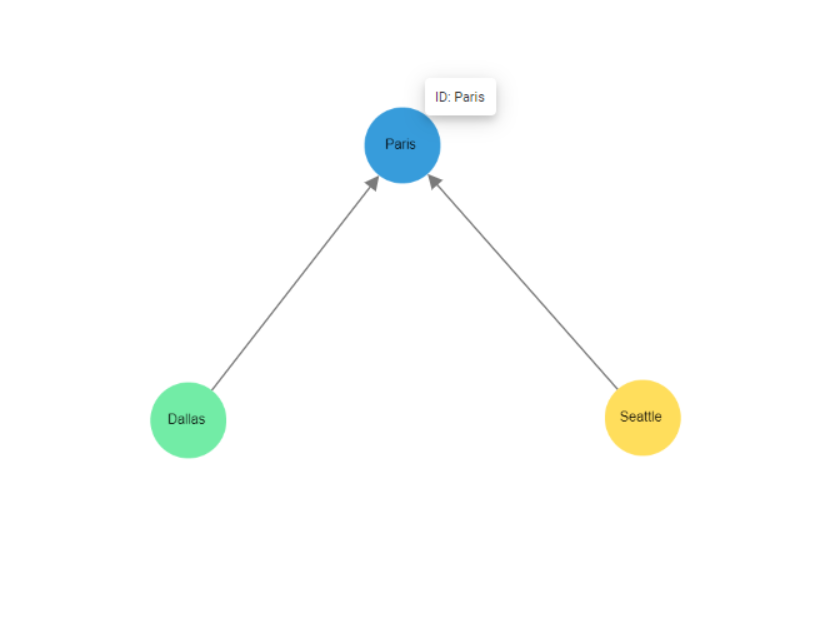
In the Network Visualizer configuration in Spotfire, we would specify the 'fromAirport' column from the data table above as our Source and ‘toAirport’ column as our Target.
This results in a graph where both Seattle and Dallas nodes will be connected to the Paris node. This graph shows you routes to Paris starting from Seattle and Dallas along with the airline and cost details.
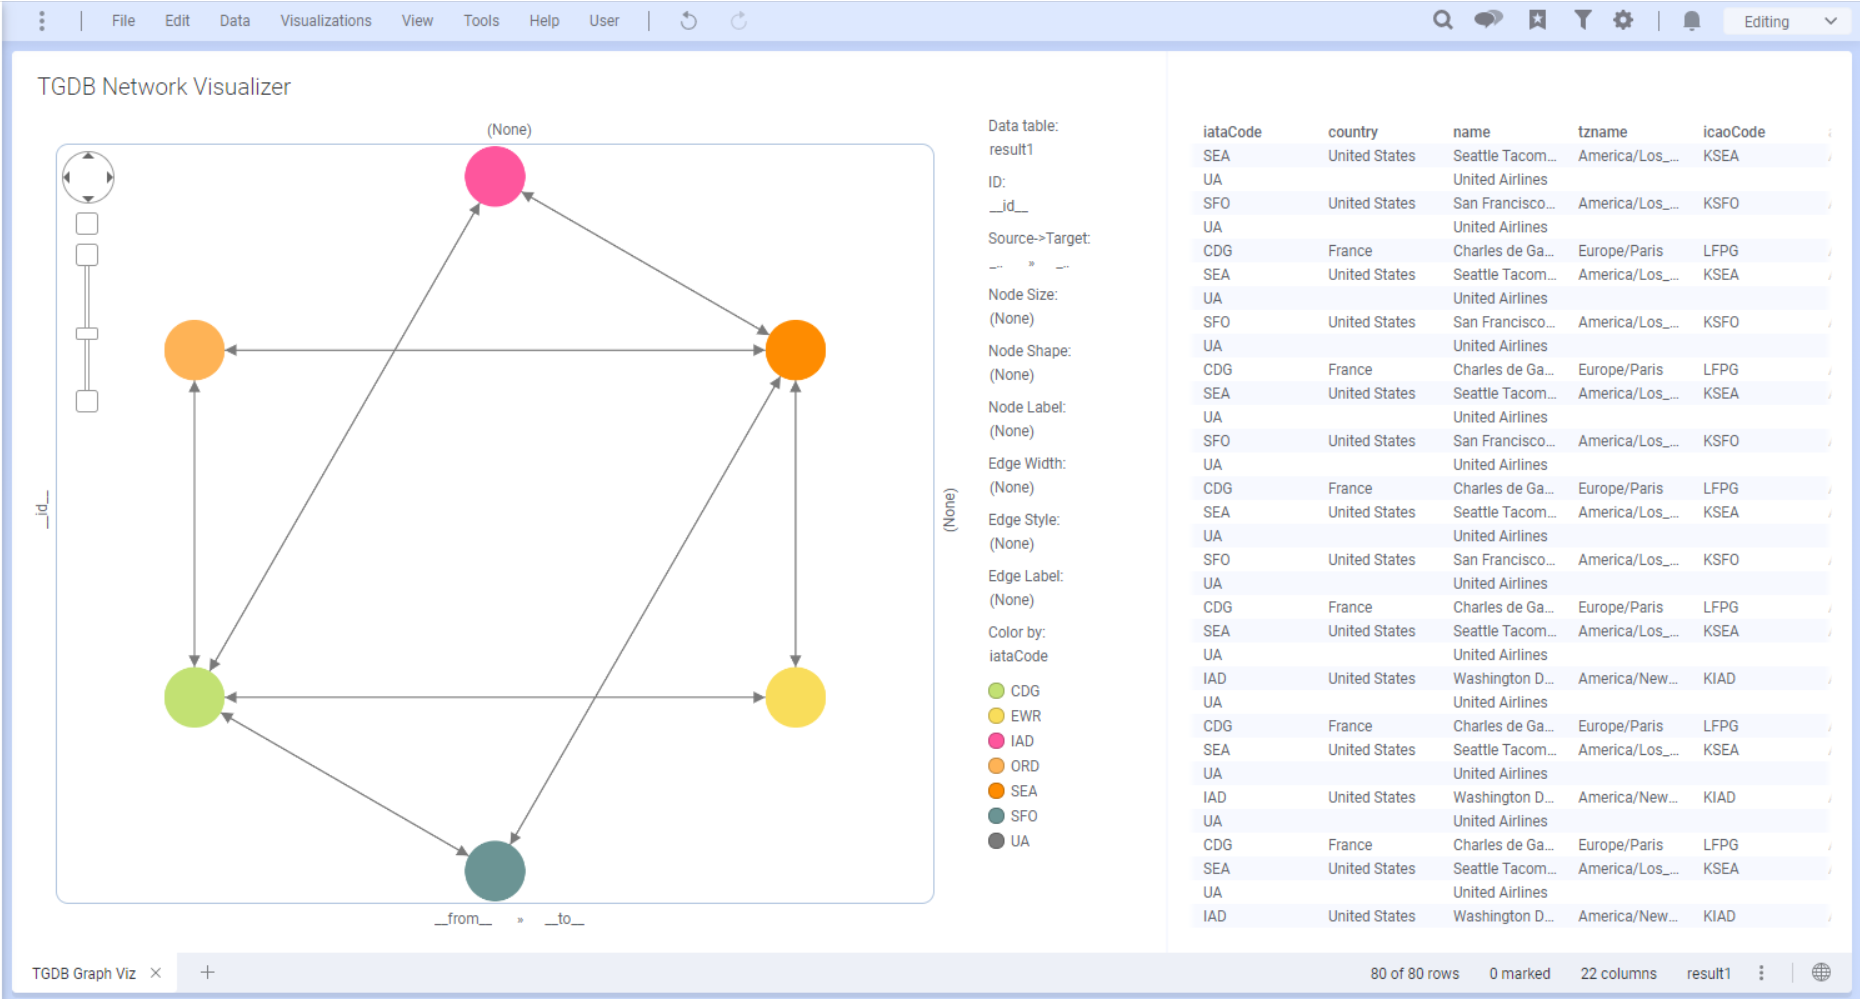
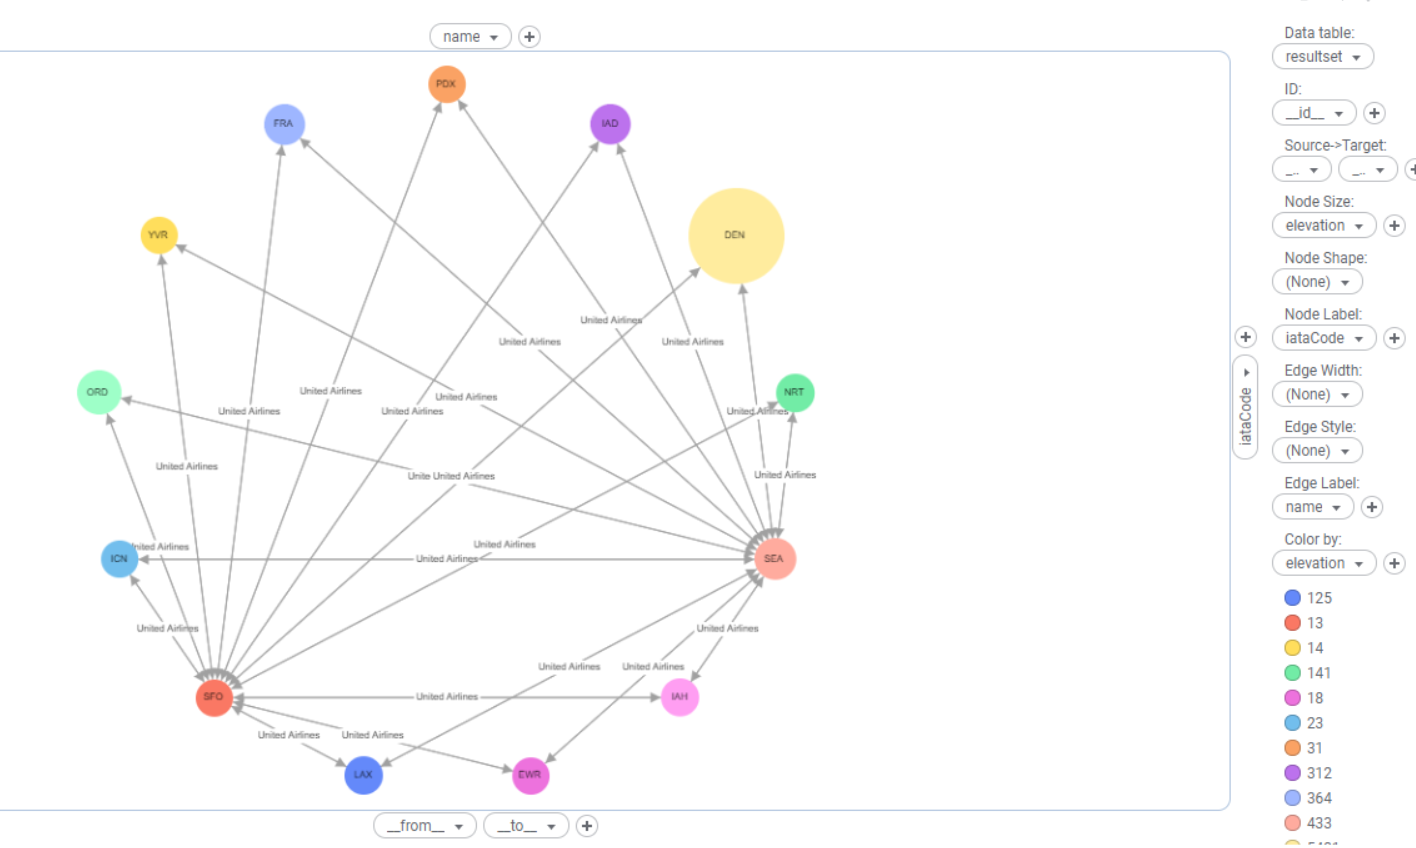
After setting the data table, Source and Target settings to tell the Network Visualizer how the data is connected (as described above), there are multiple options to configure/customize the Network Visualizer's appearance and behavior. These are:
All properties below are optional. Default values for Network Visualizer will be used for settings that have not been configured.
ID: Specifies the Id column for the nodes in the graph.
Node Size: A numerical column or value which provides the size of the nodes.The default node size is 15px.The Network Visualizer normalizes and scales the node size depending on the minimum and maximum size specified for the current set of nodes.
Node Shape: A string/text column or value which has either of the following values:
Value | Shape | Description |
ellipse | Ellipses are like circles which are stretched. It’s a regular oval shape. | |
rectangle | shaped like a rectangle | |
triangle | shaped like a triangle | |
round-triangle | Triangle with rounded corners. | |
round-rectangle | Rectangle with rounded corners. | |
bottom-round-rectangle | Rectangle in which the bottom 2 corners are round. | |
cut-rectangle | Rectangle with cut corners | |
barrel | shaped like a barrel | |
rhomboid | shaped like a rhombus | |
diamond | shaped like a diamond | |
round-diamond | A diamond with rounded corners | |
pentagon | A polygon with 5 sides and angles that add up to 540 degrees | |
round-pentagon | Pentagon with rounded corners | |
hexagon | A polygon with 6 sides and angles that add up to 720 degrees | |
round-hexagon | A hexagon with rounded corners | |
concave-hexagon | a hexagon that has at least one internal angle that is greater than 180 degrees. | |
heptagon | A polygon with 7 sides and angles that add up to 900 degrees | |
round-heptagon | Heptagon with rounded corners | |
octagon | A polygon with 8 sides and angles that add up to 1080 degrees | |
round-octagon | An octagon with rounded corners | |
star | shaped like a Star | |
tag | A shape that looks like tag used to label things | |
round-tag | tag with round corners | |
vee | shaped like a V |
Note: The default shape for the nodes is “ellipse”, if no column/value is specified.
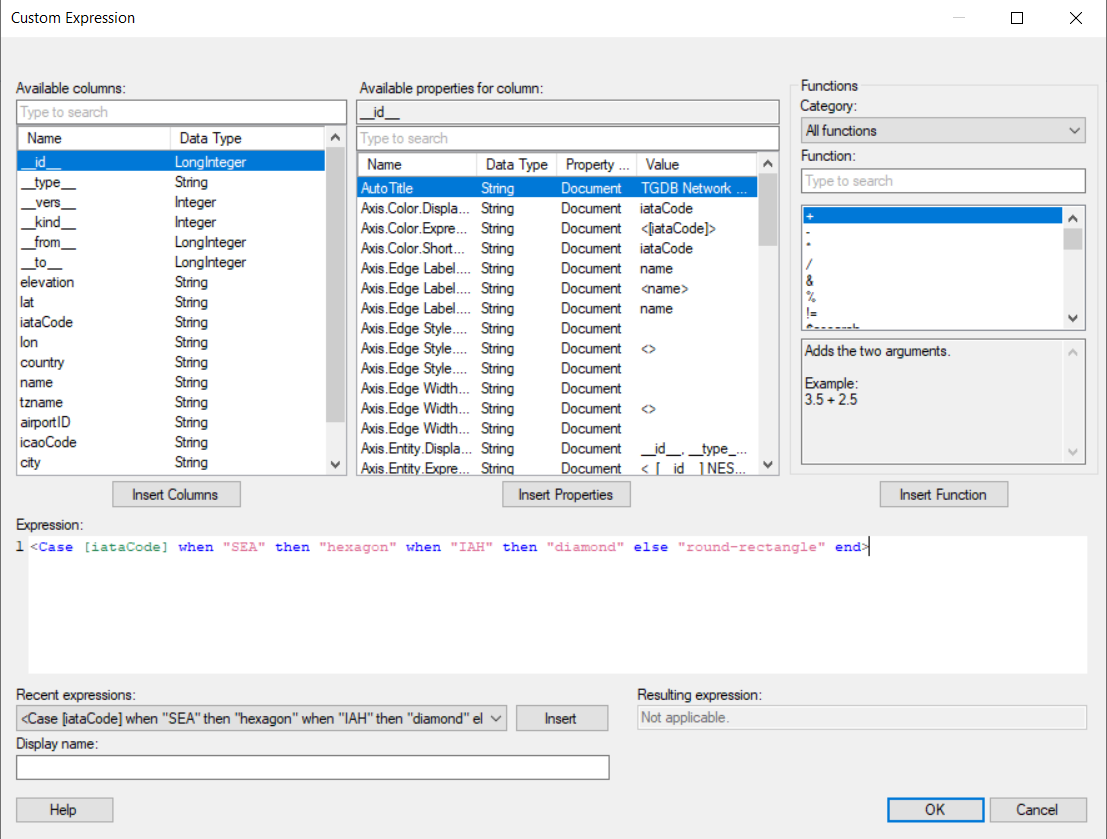
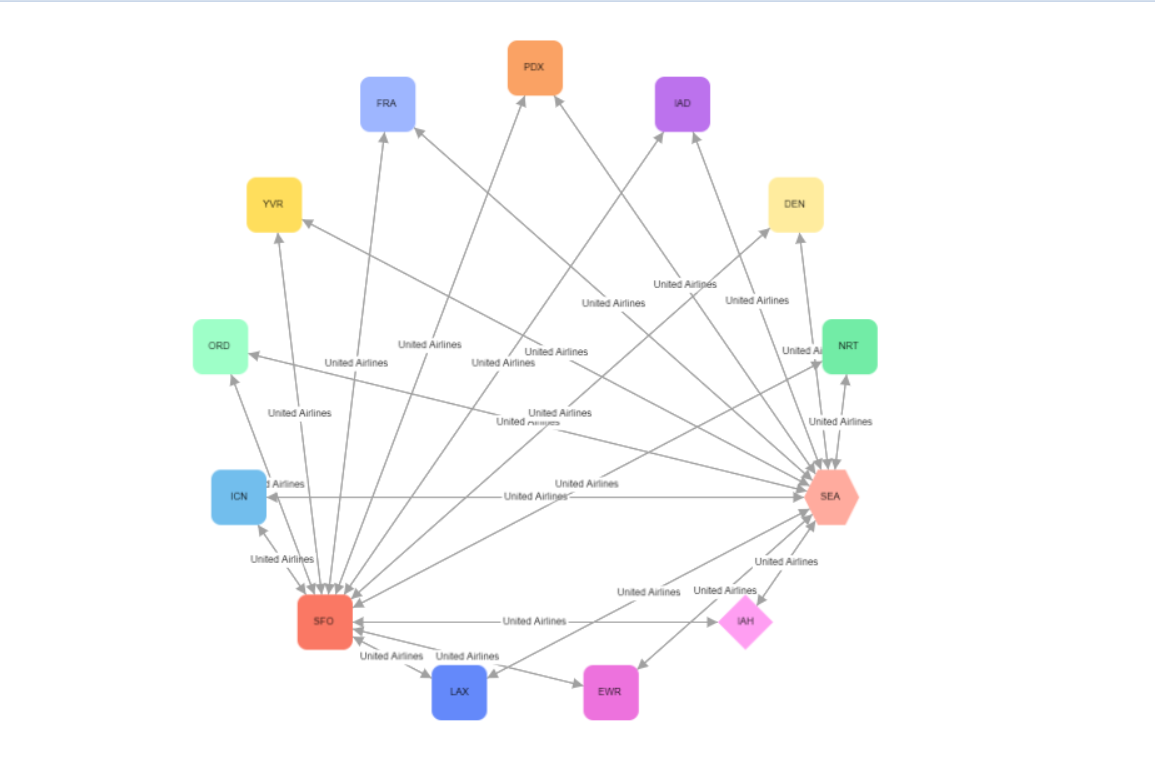
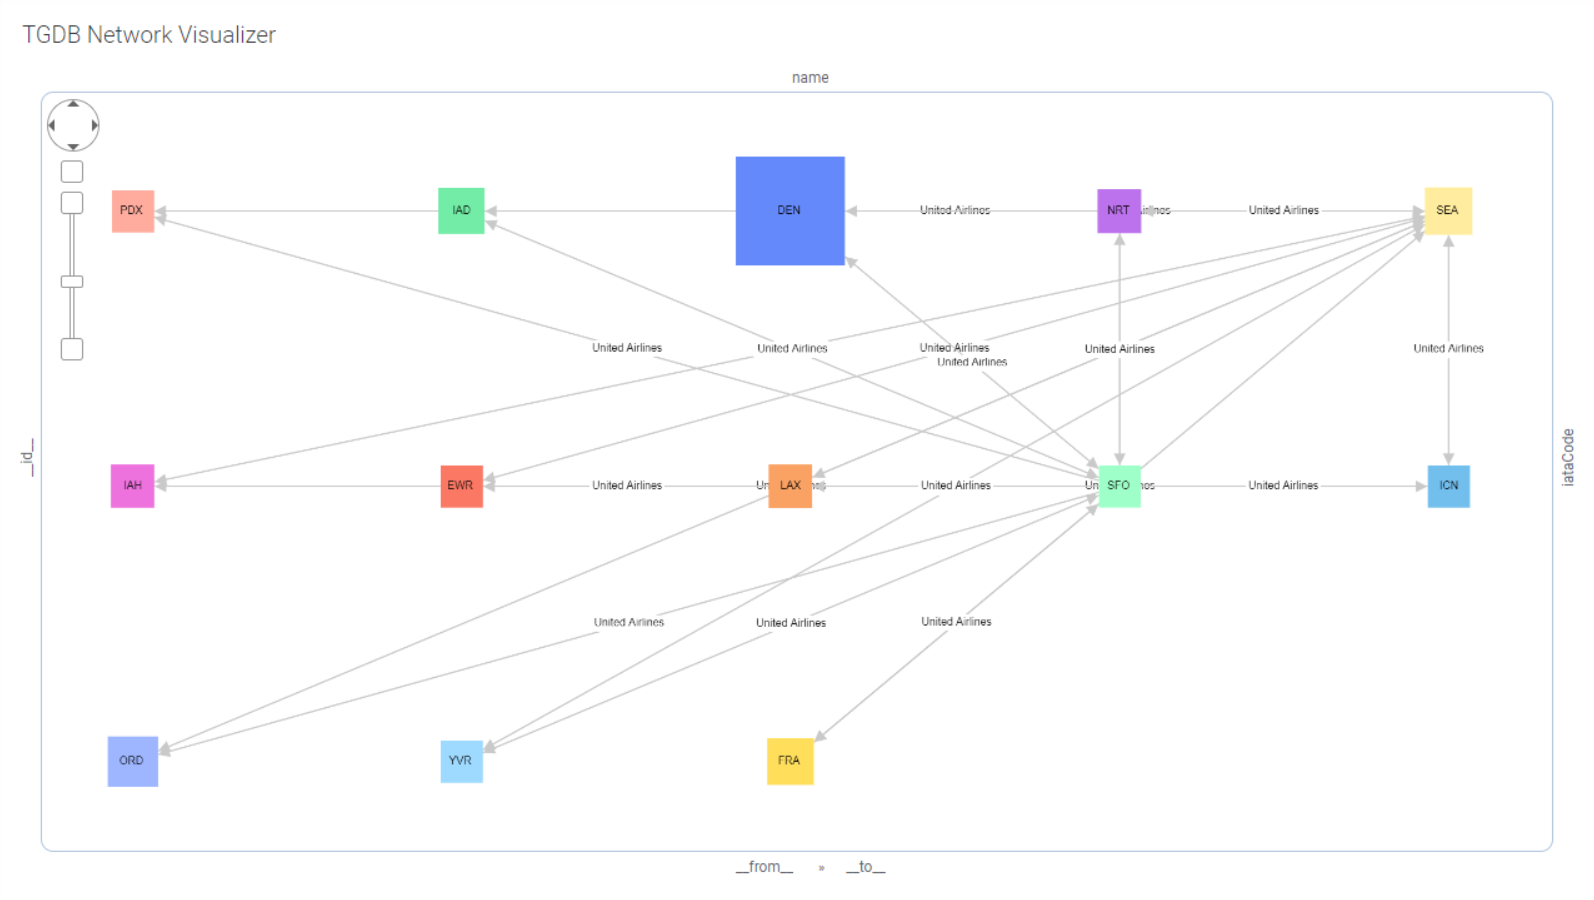
You can also use the Spotfire Axis custom expression feature to configure the node shape values. You can specify a particular shape for nodes depending on the value of a specified attribute. For example, as shown below, all the nodes that have value ”SEA” for the “iataCode” attribute will be shaped as a hexagon, nodes that have value "IAH" will be shaped as a diamond, and the rest of the nodes will be shaped as a round rectangle.
To know more about the Custom Expressions, see the Spotfire Documentation here.
Edge Width: A numerical column or value that determines the width of the edge connecting two nodes. The max edge width supported is 5px, the Network Visualizer Mod automatically normalizes and scales the edge width depending on the minimum and maximum value specified for the current set of edges in the visualization.
Edge Style: A string/text column or value that specifies the curve style for the edges and has either of the following values:
Name | Image | Description |
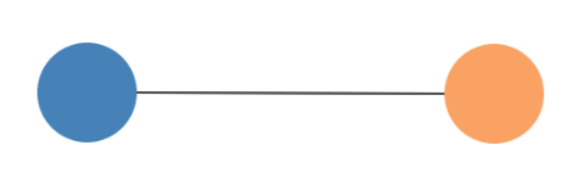
straight | A straight edge is drawn as a single straight line from the source node shape to the target node. | |
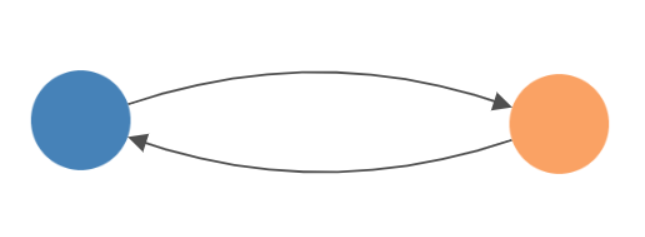
bezier | A bezier edge is a quadratic bezier curve, separated from the others by varying the curvature. If there is an odd number of parallel edges in a bundle, then the center edge is drawn as a straight line. | |
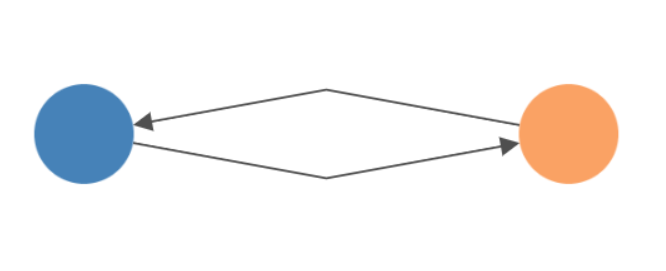
haystack | A haystack edge is drawn as a straight line from the source node to the target node, randomly placed along some angle from each node’s center. In this manner, many parallel haystack edges make a tight bundle. | |
segments | A segment edge is made of a series of one or more straight lines, using a coordinate system relative to the source and target nodes. | |
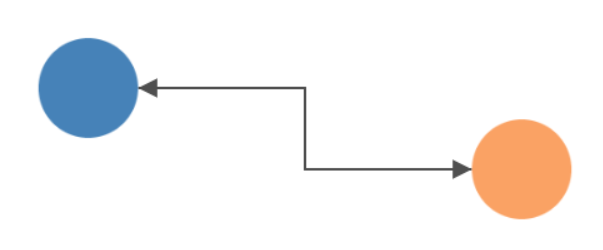
taxi | A taxi edge is drawn as a series of right-angled lines. |
Note: The default edge curve style for the edges is “straight”.
Similar to the Node Shape axis (as described in the previous section) you can apply custom expressions for the Edge Style axis also.
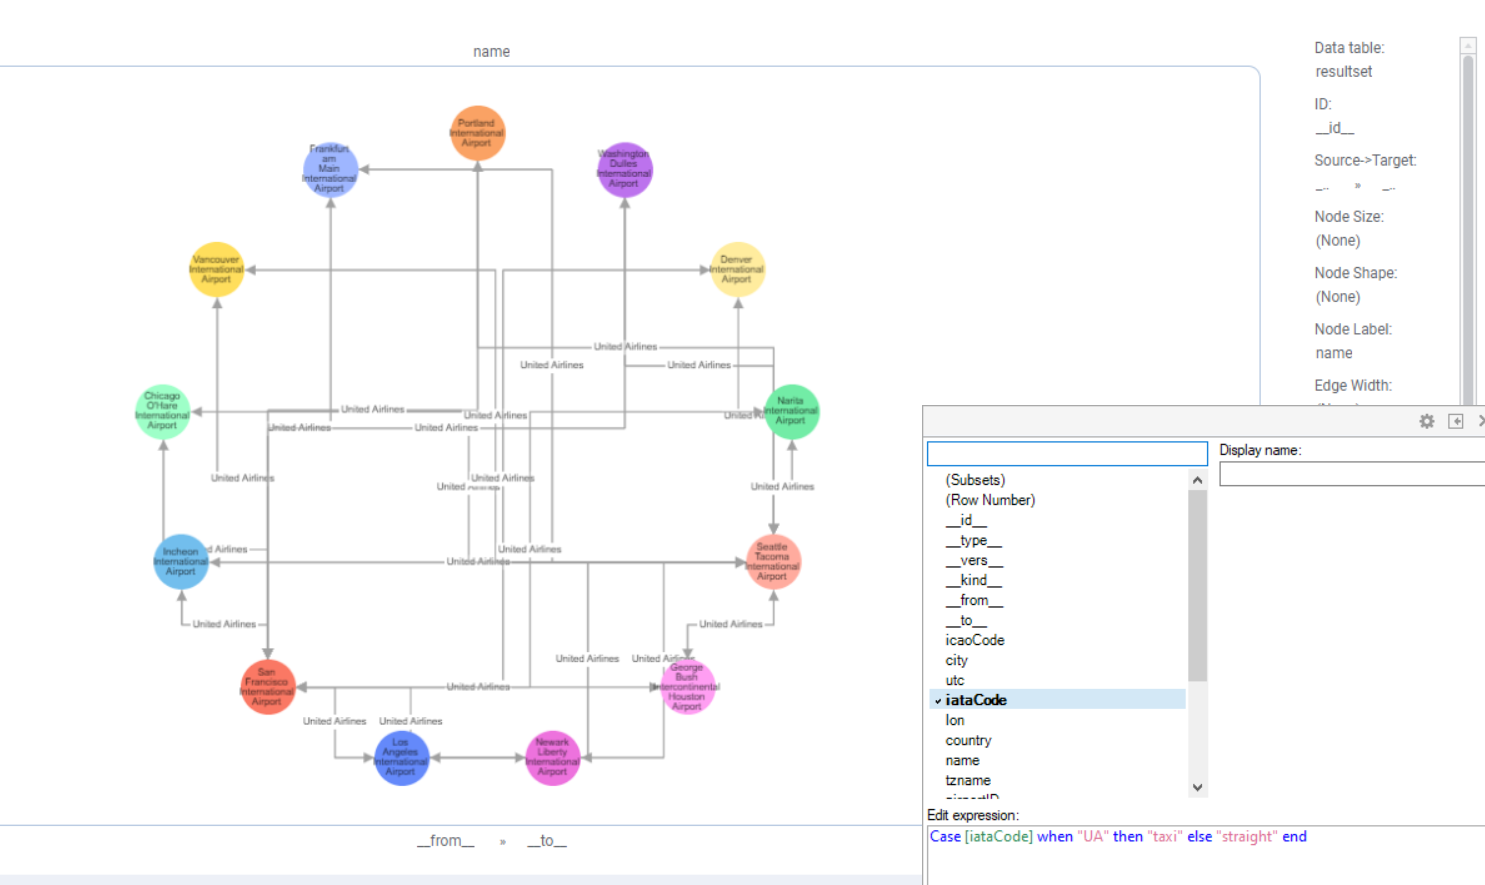
Here is a sample graph loaded in TGDB Network Visualizer Mod showing how a custom expression can be applied to the Edge Style axis depending on specific edge attribute values.
For example, to all the edges with value “UA” for “iataCode” attribute, “taxi” will be applied as a curve style, rest of the edges will have the curve style as “straight”.
Color By: Standard Spotfire control for settings the color for each node or an edge. |
Node Label: These are the labels that will be displayed for each node. If no column is specified, the Network Visualizer defaults to an empty label.
Edge Label: These are the labels that will be displayed for each edge. If no column is specified, the Network Visualizer defaults to an empty label.
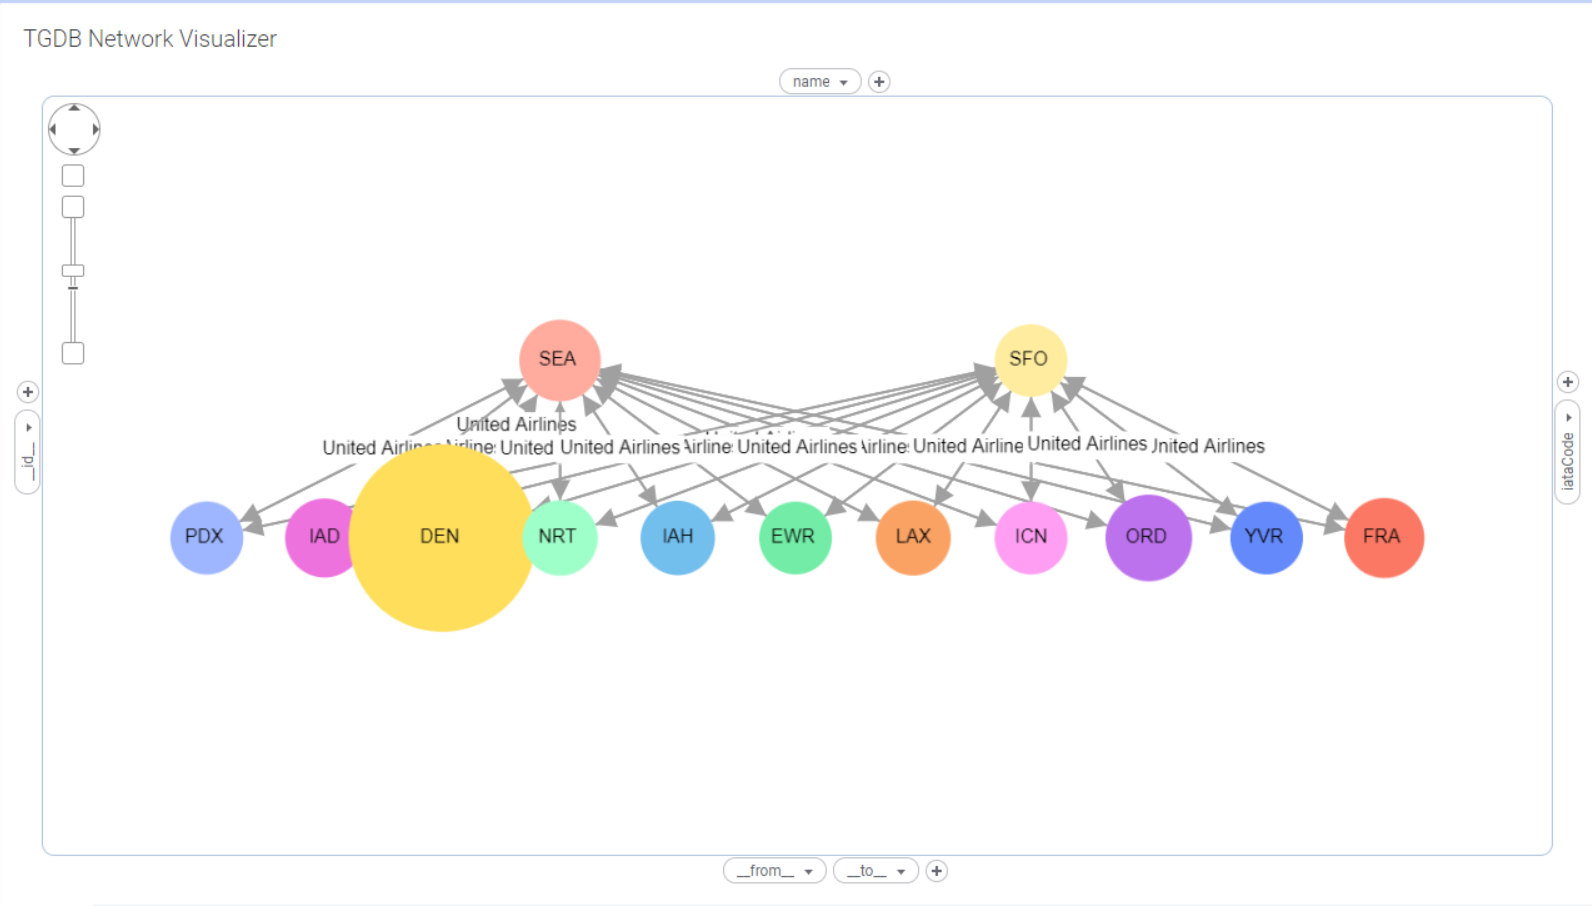
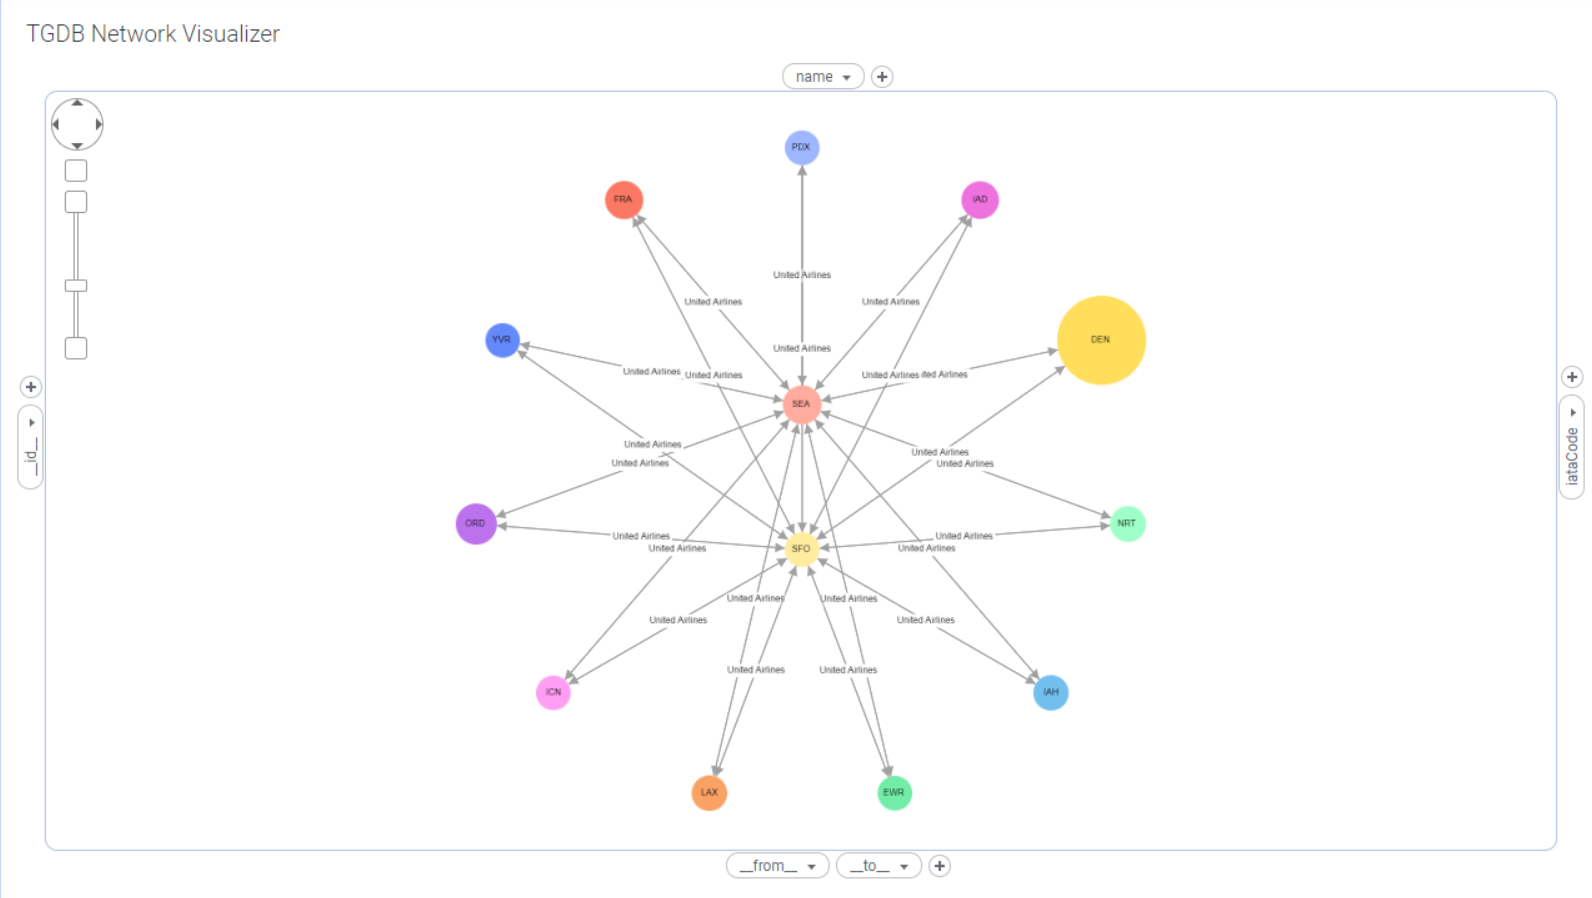
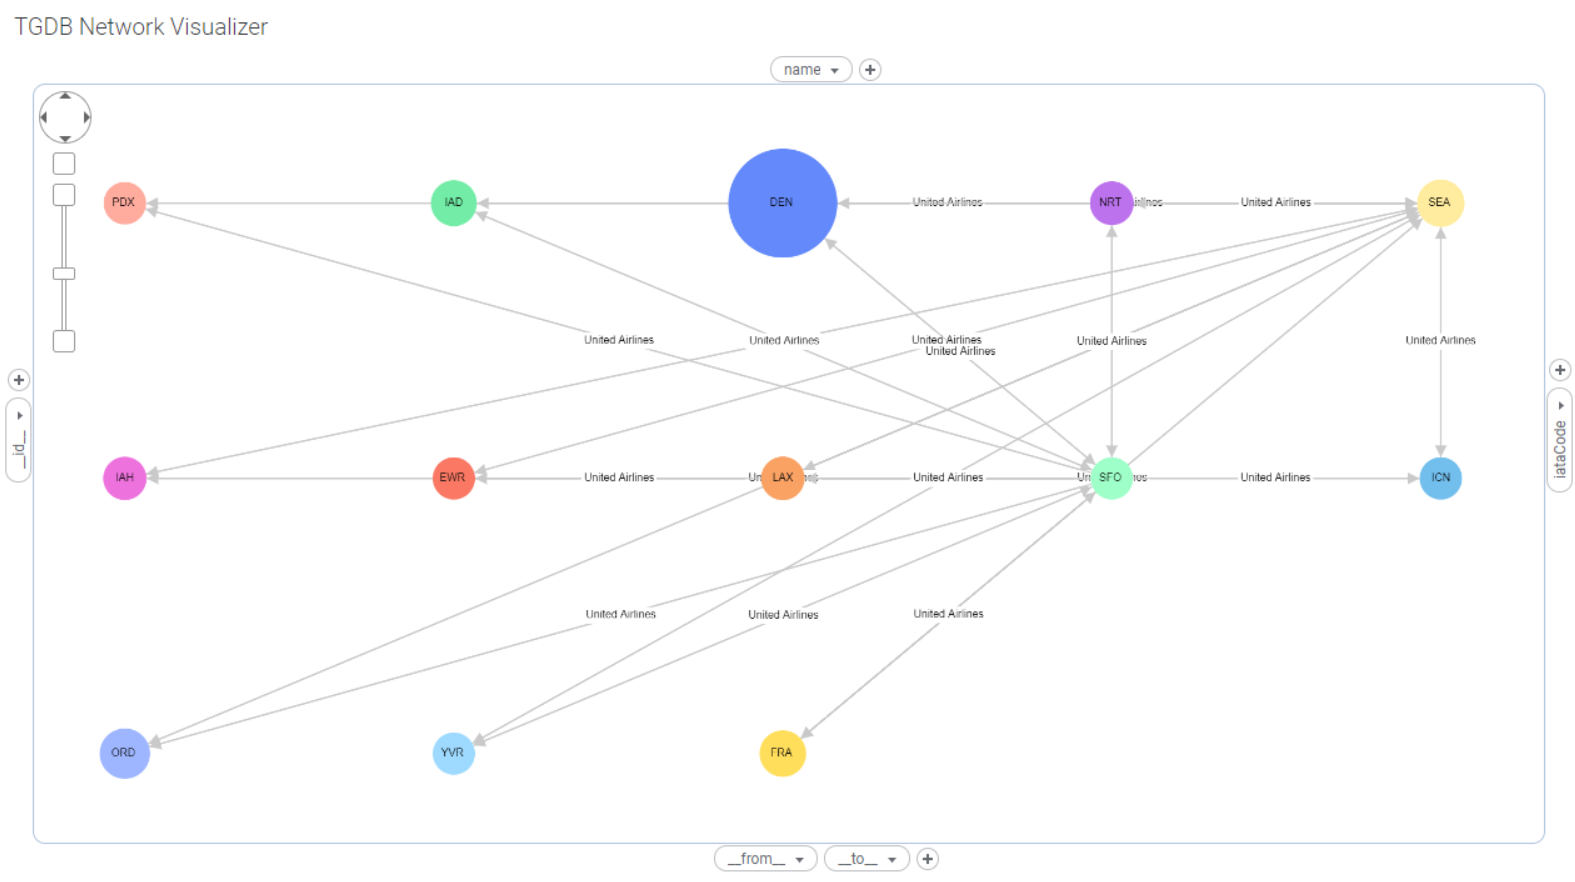
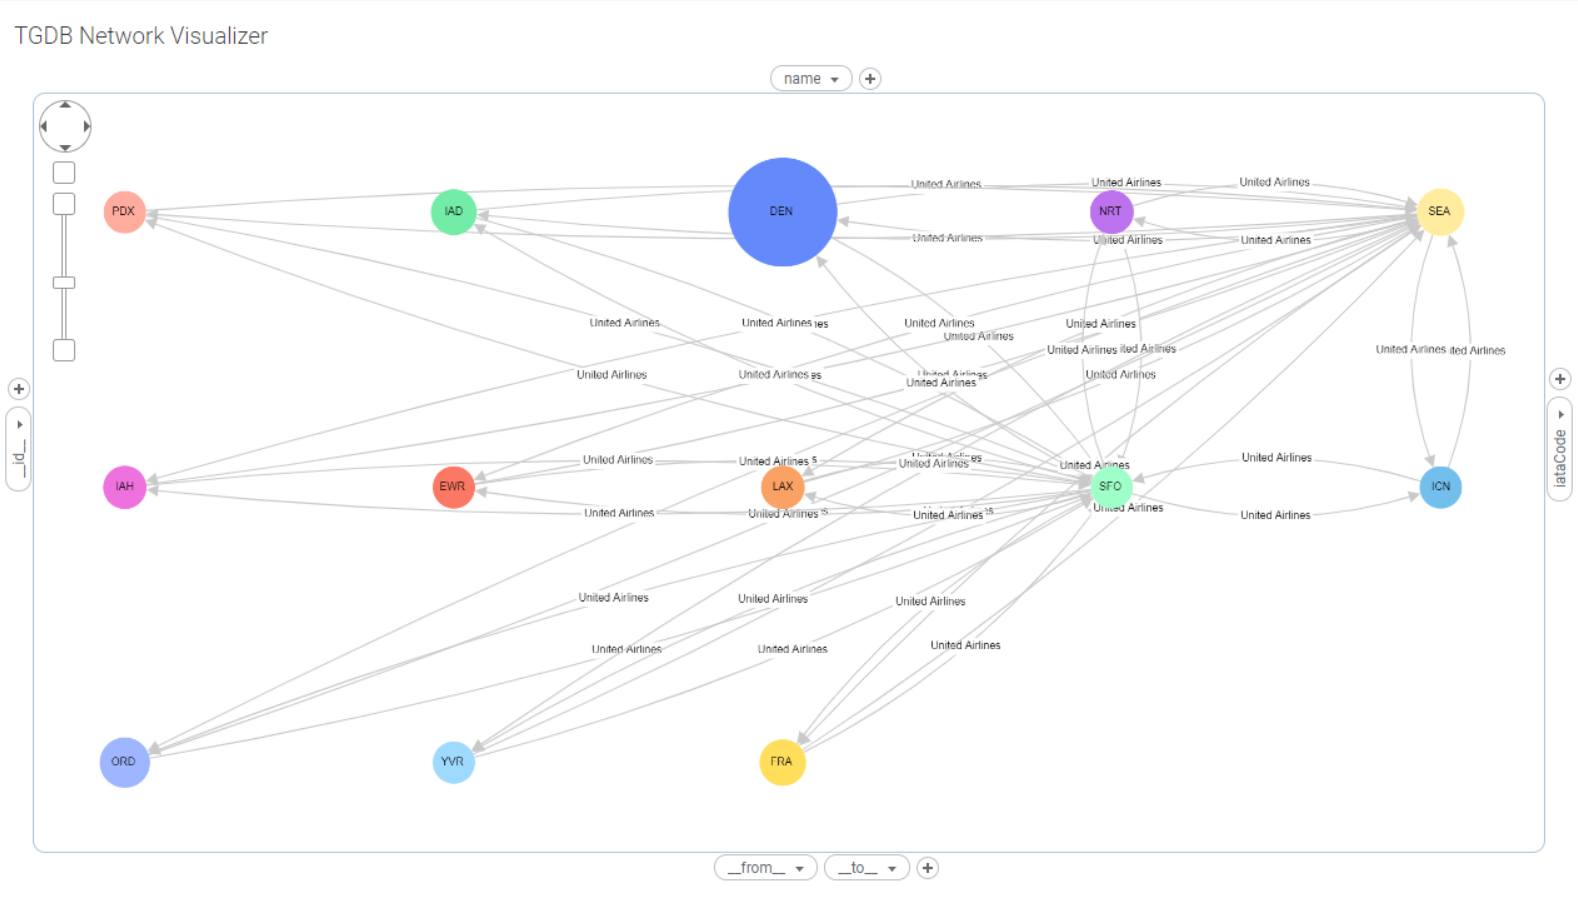
Once the Network Visualizer mod is configured and has the required data provided, it will render the graph. Individual nodes can be dragged and moved to help alter the graph displayed.
Clicking a node will mark the node in the graph and in all other visualizations that use the same marking.
Multiple nodes can be marked by clicking on the visualization area in the Network Visualizer and then dragging the mouse to include the required nodes. All the edges connecting the selected nodes will automatically be selected.
It is also possible to click on the edge between nodes to mark it.
Users can change Node or Edge properties using the different axes provided in the Network Visualizer mod Legend section. |
Users can also change Graph layouts and a limited set of node and edge properties using the Mod Pop Out (described in detail in the next section).
The Network Visualizer mod supports a custom mod pop out that enables users to change different properties related to graph, nodes and edges.
You can change different properties by clicking on the Apply button to apply the selected properties to the current graph in the mod.
Inside the Network Visualizer mod area, hold the left mouse click to launch the mod pop out dialog. Make sure to click an empty area inside the visualization and not on nodes or edges in the graph.
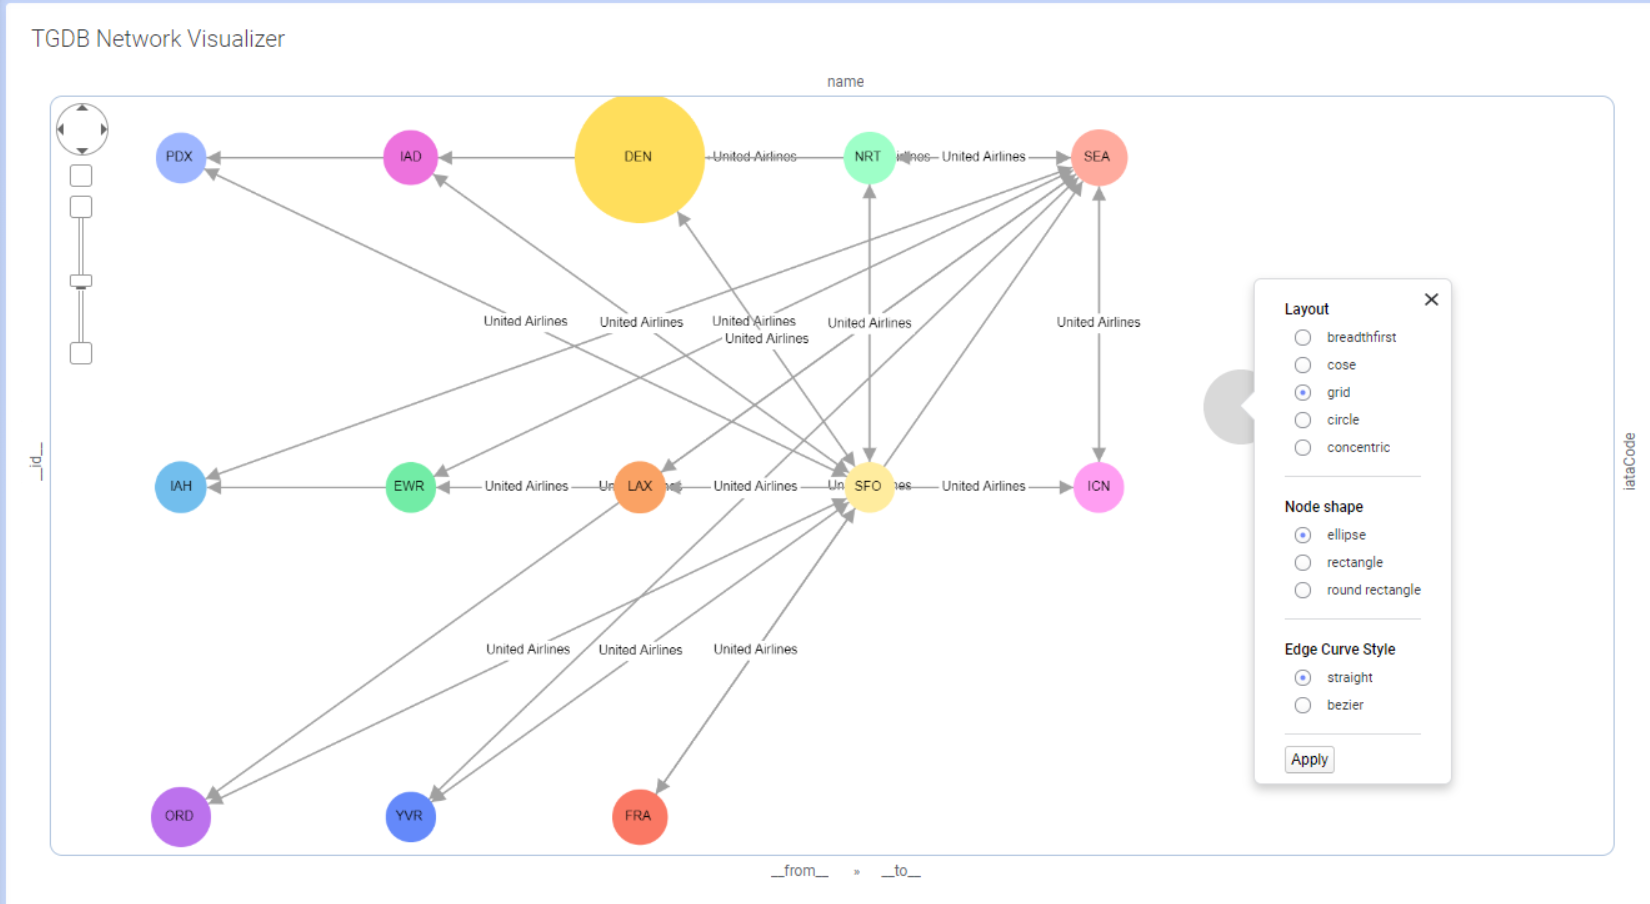
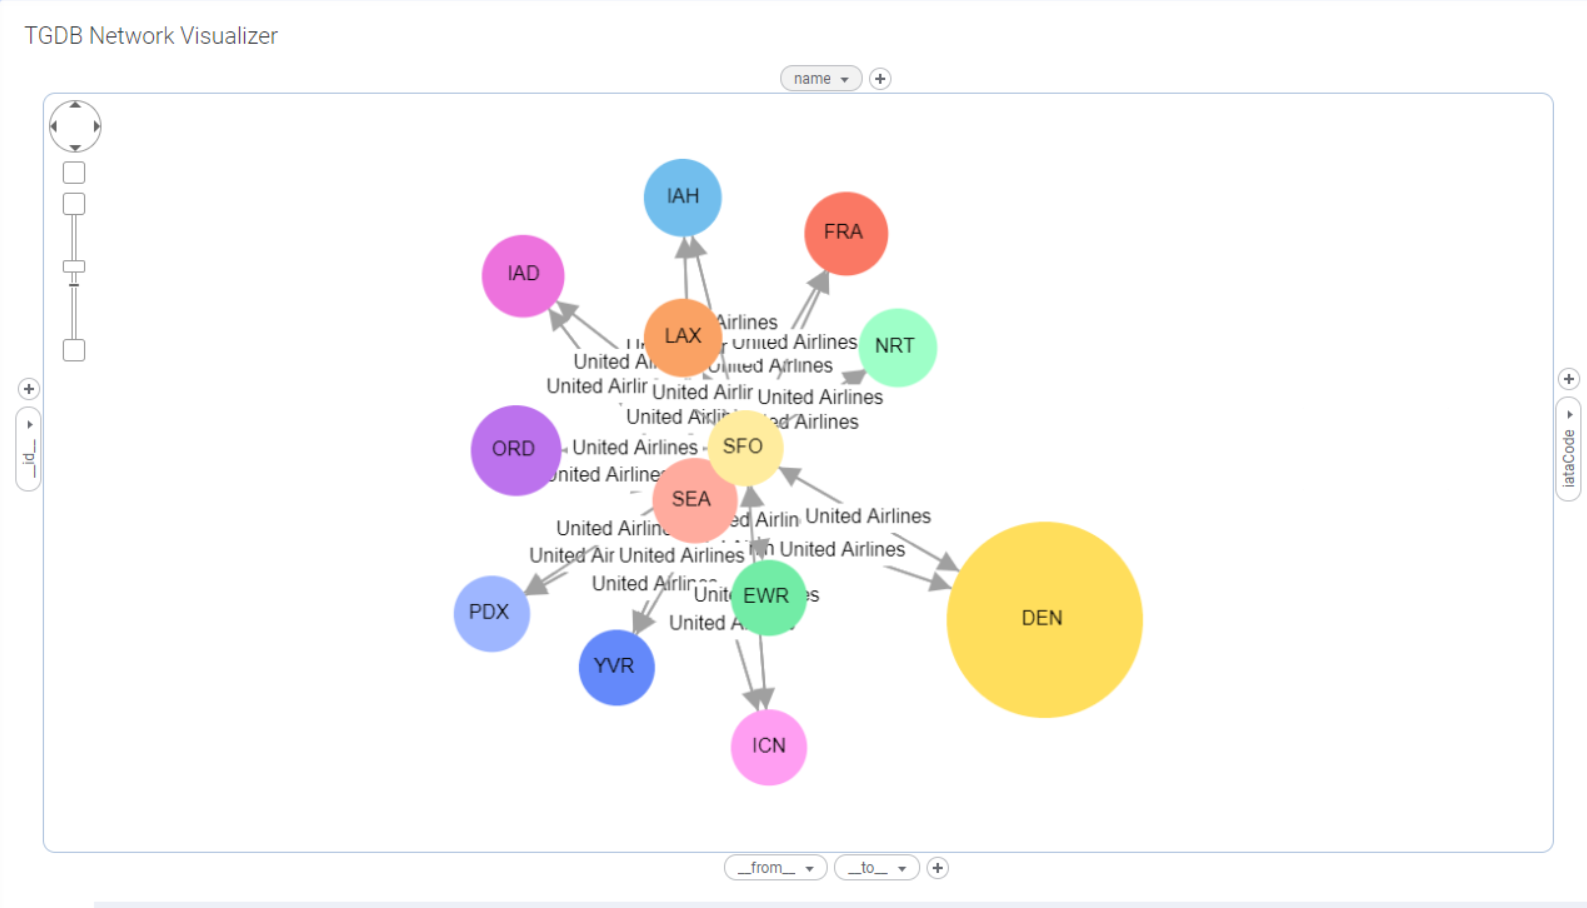
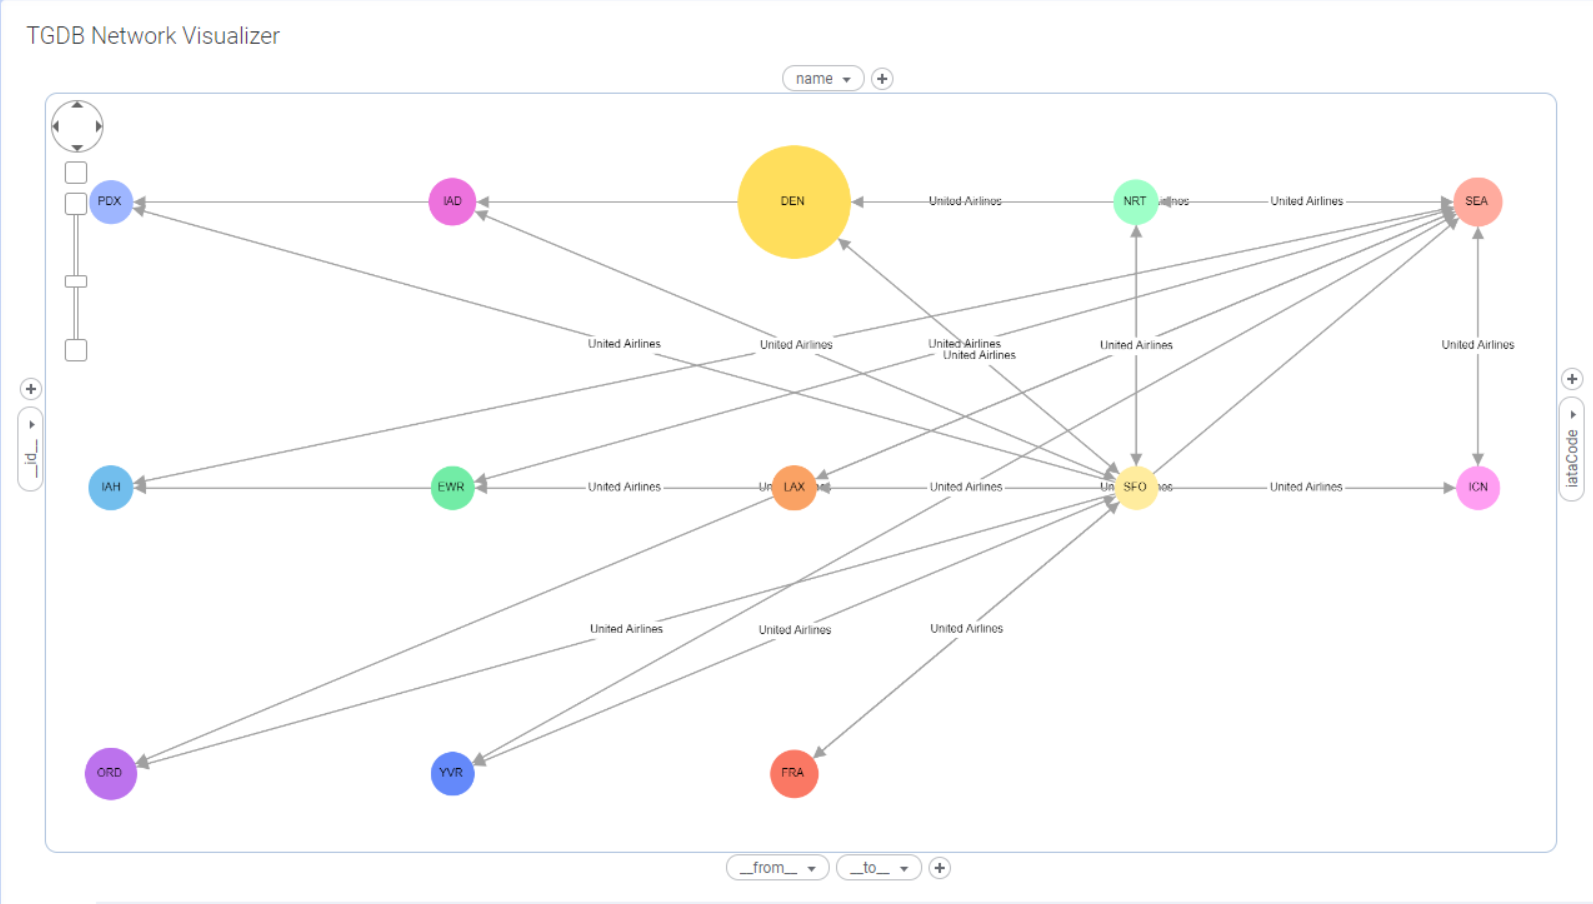
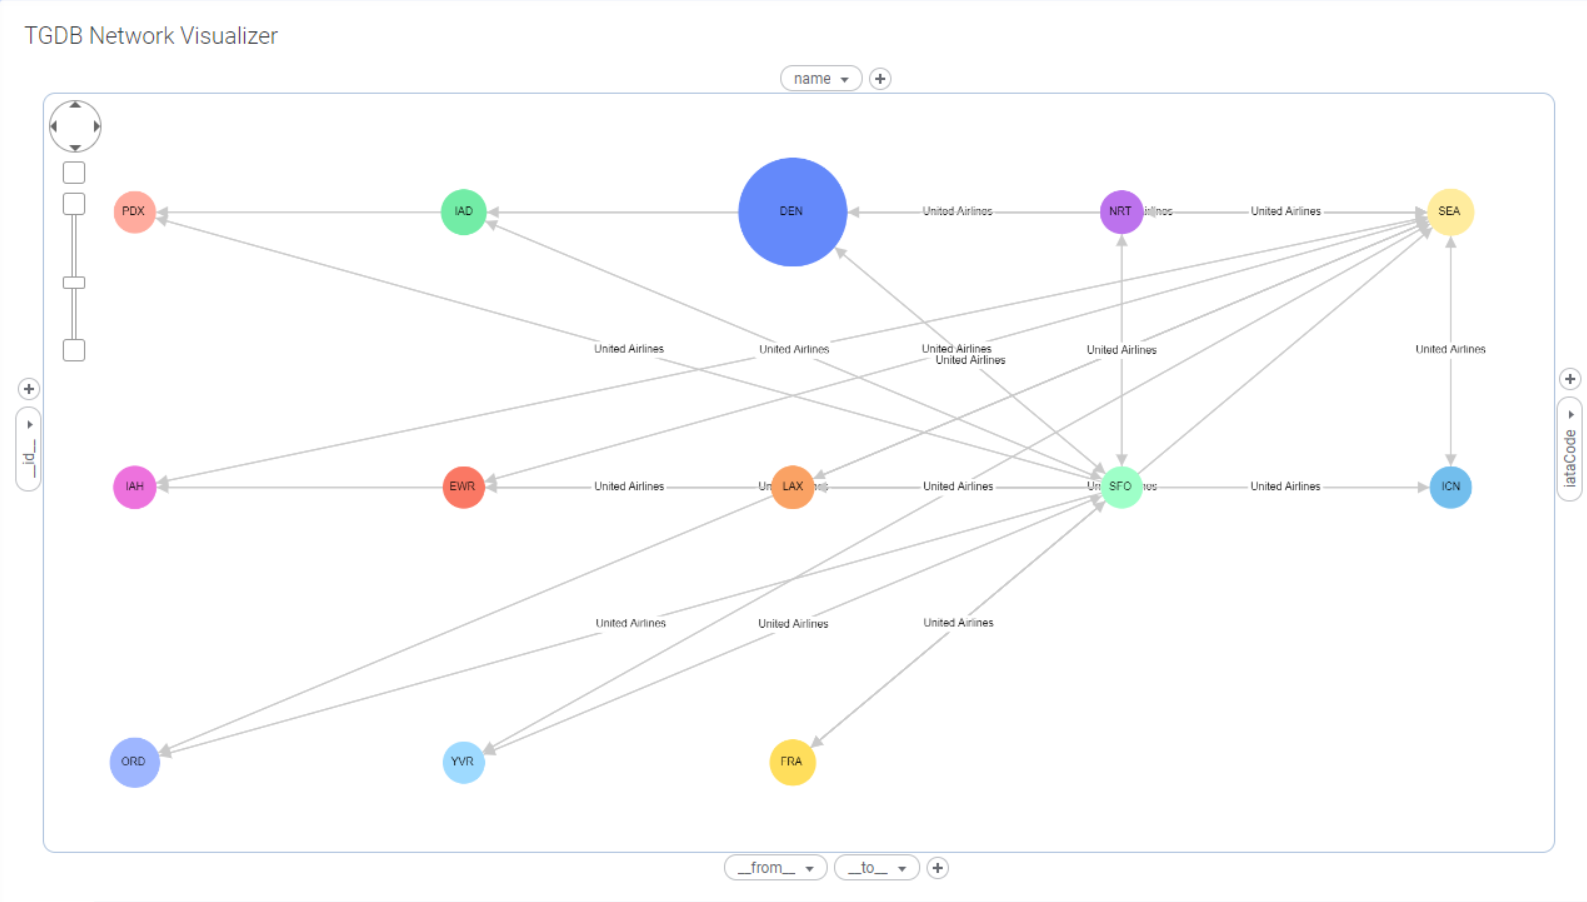
Using the mod popout, you can change the layout of the graph using the layout options. Following graph layouts are supported:
Using the mod popout you can change the properties of the nodes in the graph. Following node shapes are supported:
rectangle
Using the mod popout you can change the properties of the edges between nodes in the graph. Following edge curve styles are supported:
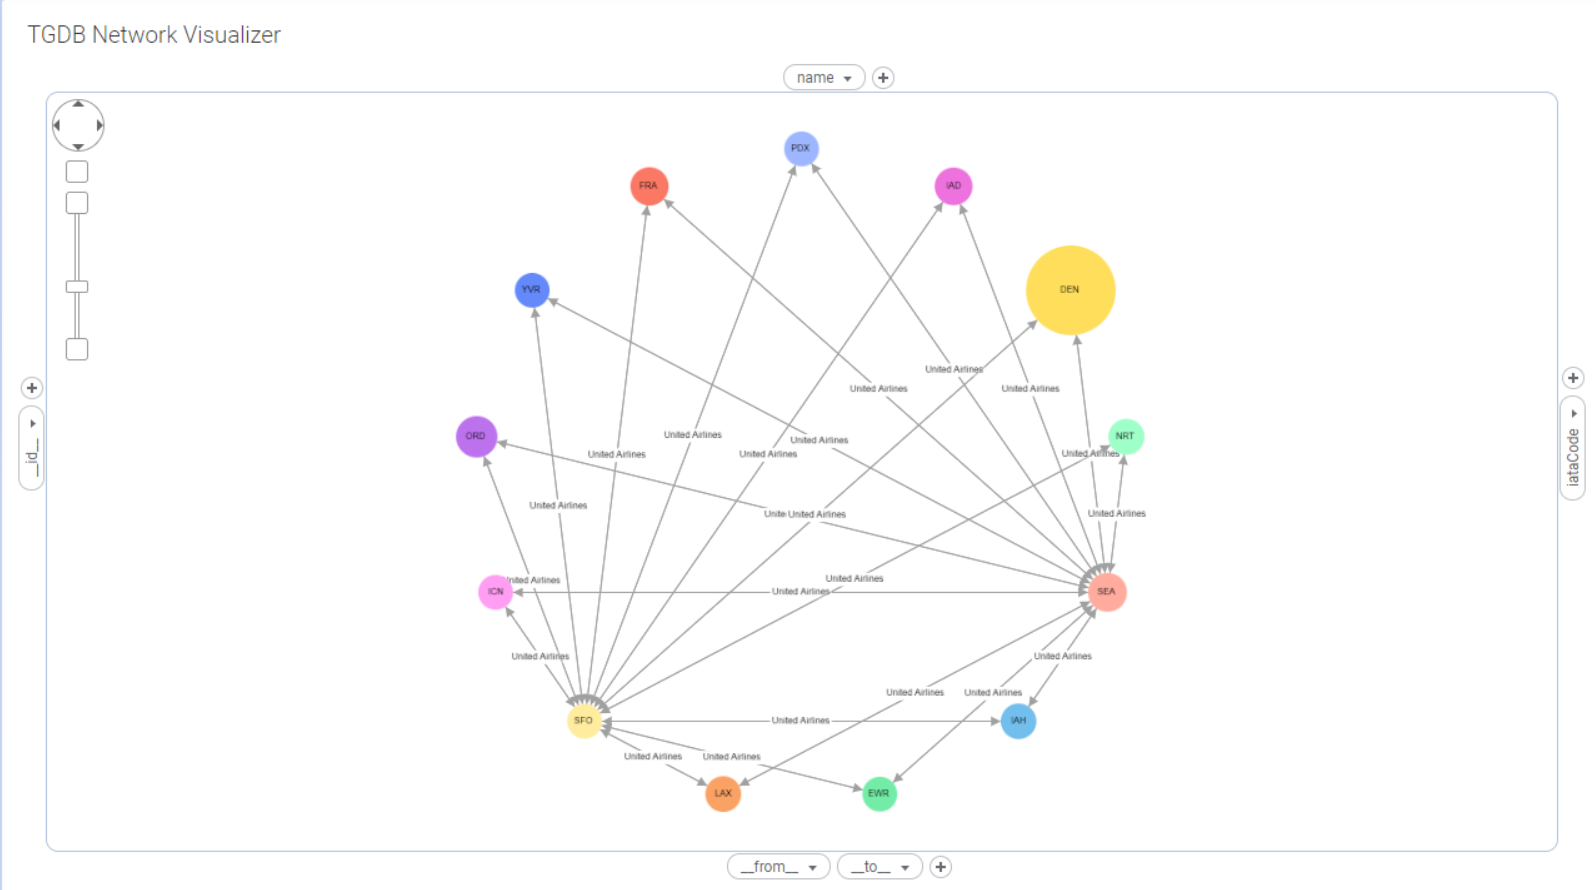
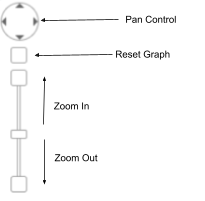
The TGDB Network Visualizer mod allows users to pan, zoom and reset the graph to the original orientation using the Panzoom control located in the top left corner of the visualization area. Here are the different options in the pan zoom control.
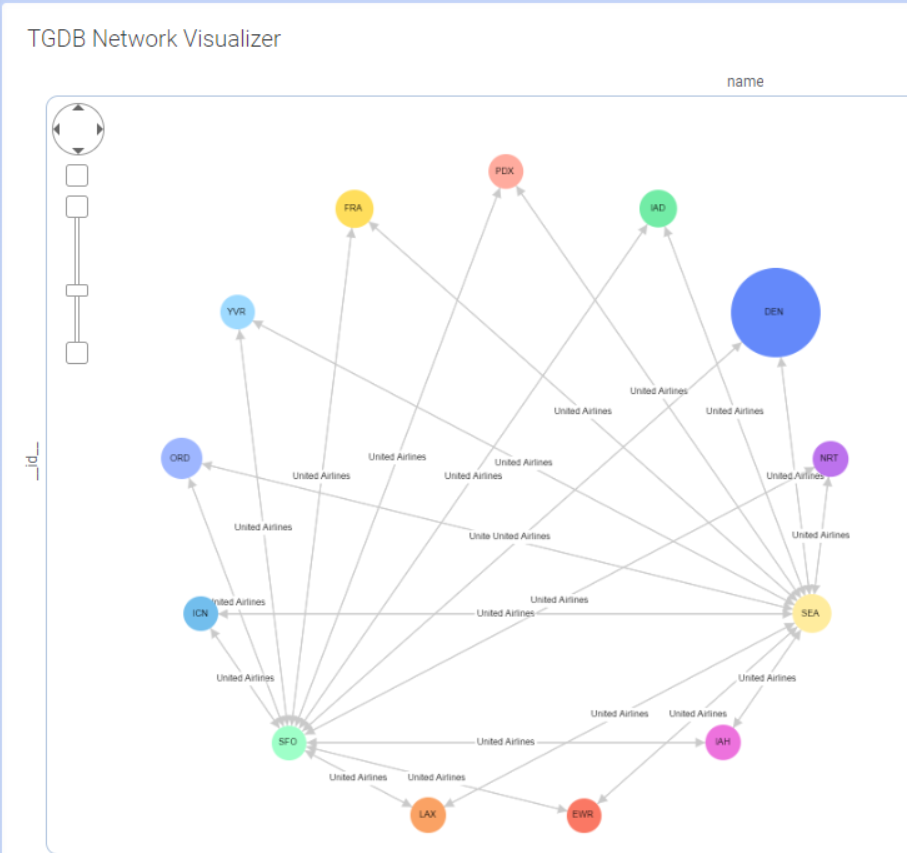
Here is how a graph rendered in TGDB Network Visualizer looks, after applying the zoom in feature from the pan zoom control.
Default | Zoomed in |
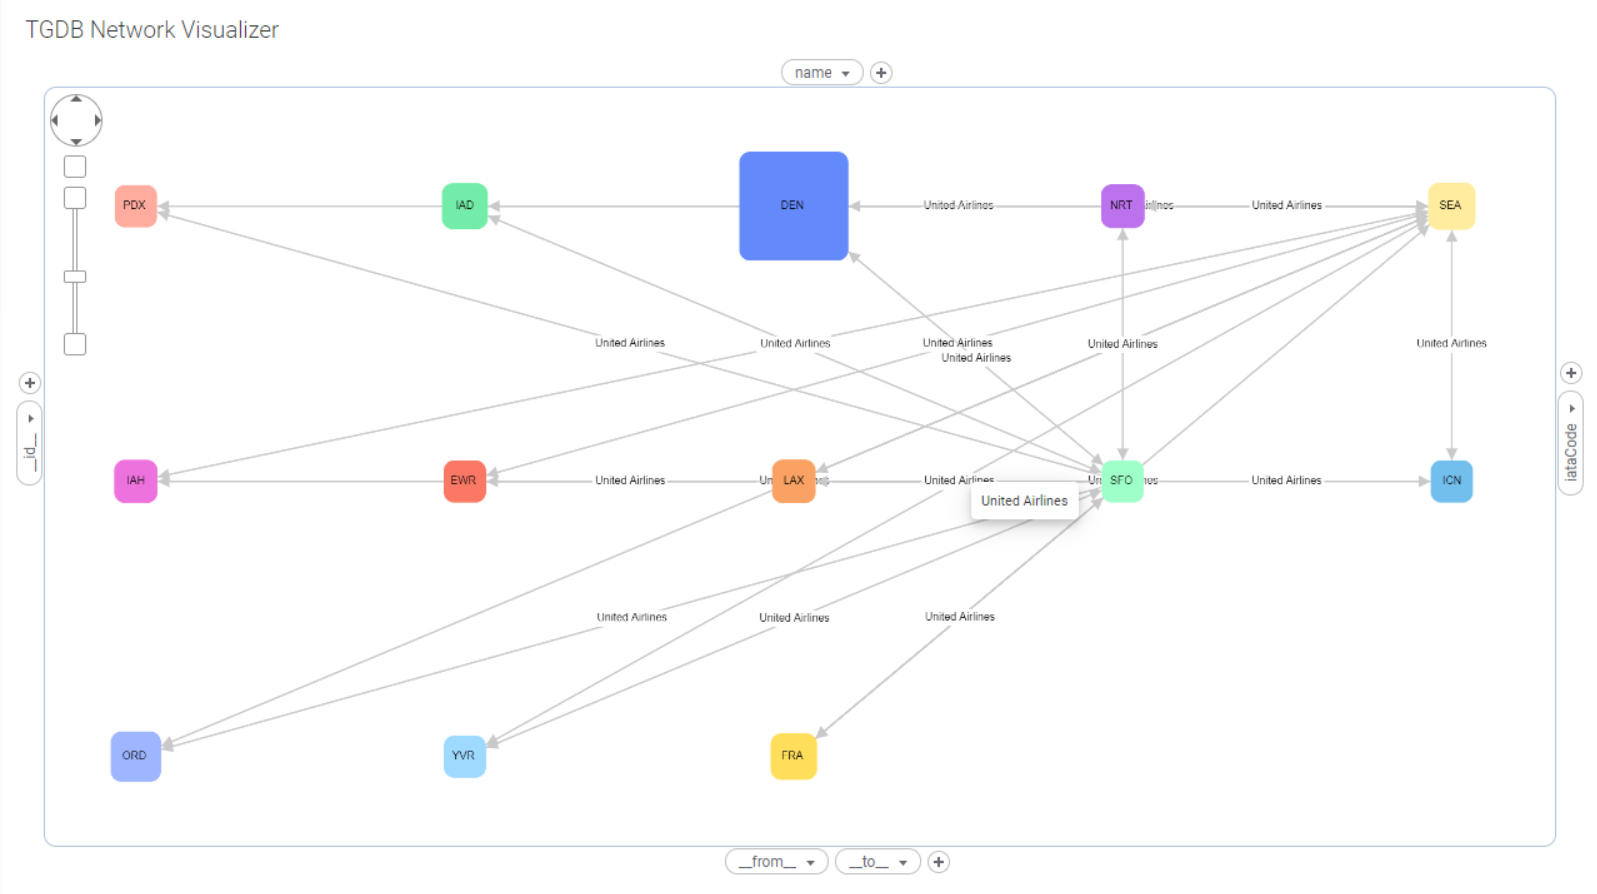
TGDB Network Visualizer supports native Spotfire tooltip. Users can configure what to show in the tooltip, just like any other Spotfire visualization. To see the tooltip you need to hover over a node or an edge in the graph.
In TGDB Network Visualizer, you can also show images on your tooltip. If your input data table consists of a column containing image URLs, you can use that column as a part of the tooltip to display images when you hover on nodes or edges.
Let’s see how to add images in the tooltip. We will be using the same data table used in Setting up the TGDB Network Visualizer section with a small change. We have added a column Image, that contains URLs for images for the corresponding rows.
fromAirport | toAirport | Airline | Cost | Description | Image |
Seattle | 0 | Seattle International Airport | file:///C:/Users/sneha/workspace/Airlines/Seattle.png | ||
Paris | 0 | Paris International Airport | file:///C:/Users/sneha/workspace/Airlines/Paris.png | ||
Seattle | Paris | U234 | 1000 | 4 AM flight to Paris | |
Dallas | Paris | U345 | 1200 | 6 AM flight to Paris | |
Dallas | 0 | Dallas International Airport | file:///C:/Users/sneha/workspace/Airlines/Dallas.png |
Here, the URL is specified as file:///<Image_URL> . Remember to use forward slash(/) while specifying the path from windows. Refer to the Spotfire documentation for more details on the Image URLs.
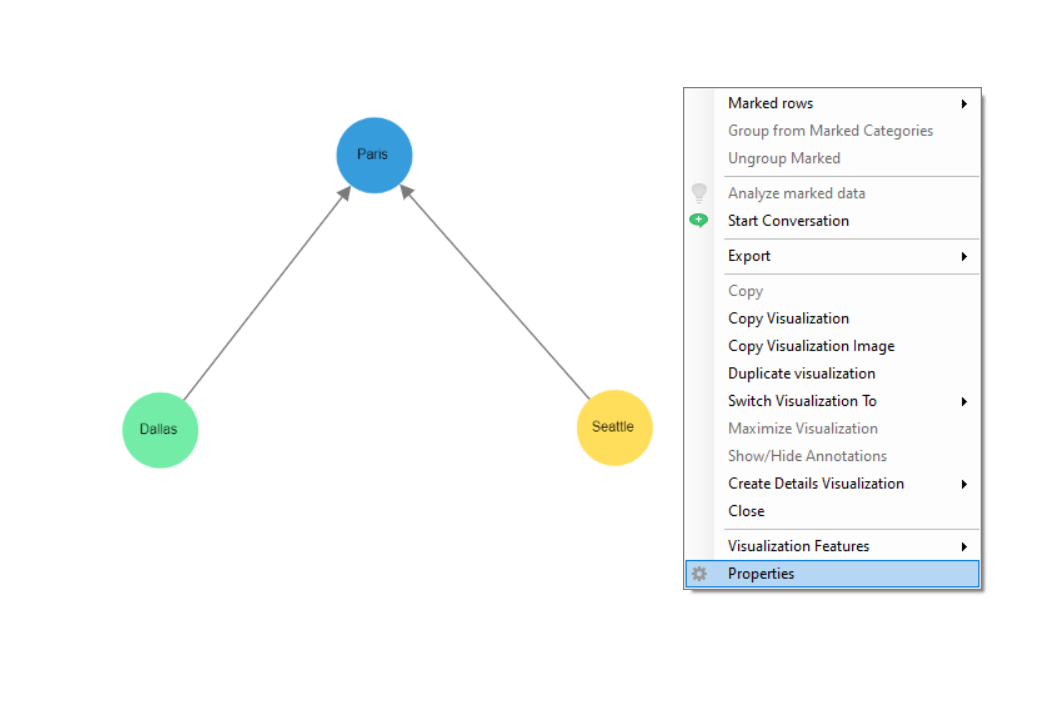
Inside the Network visualizer mod area, hold the right mouse click to launch the Spotfire properties menu dialog.
Click on Properties.
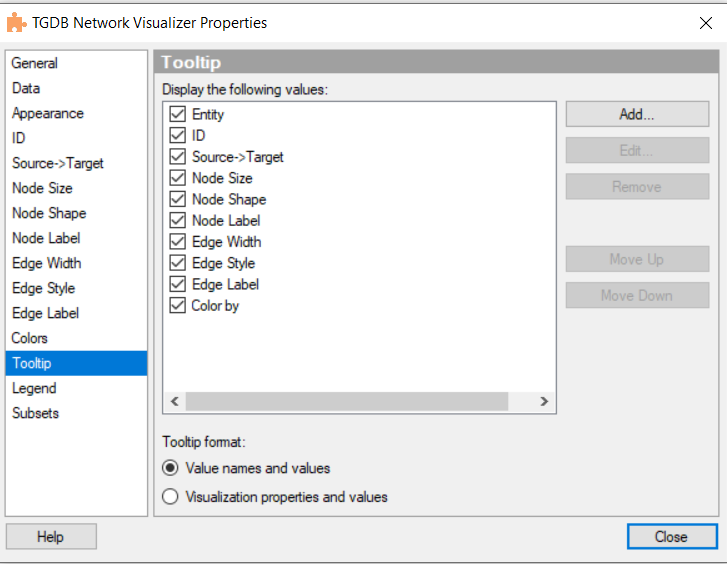
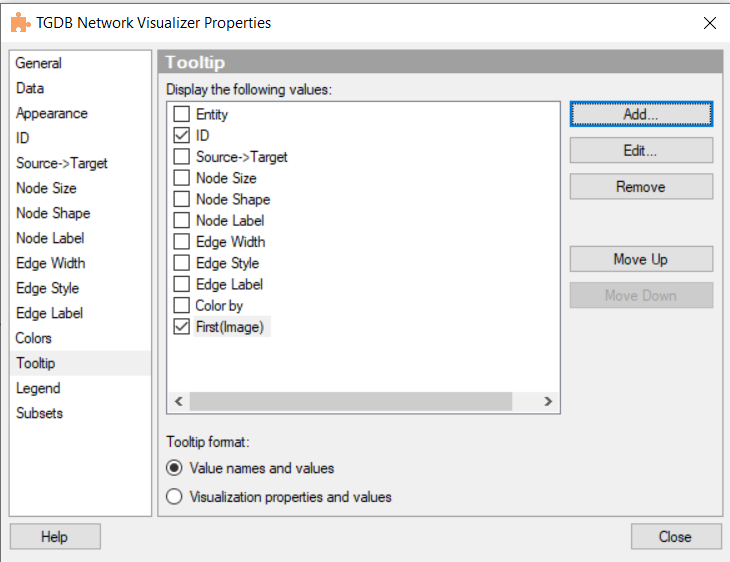
This should launch the TGDB Network Visualizer Properties dialog box.
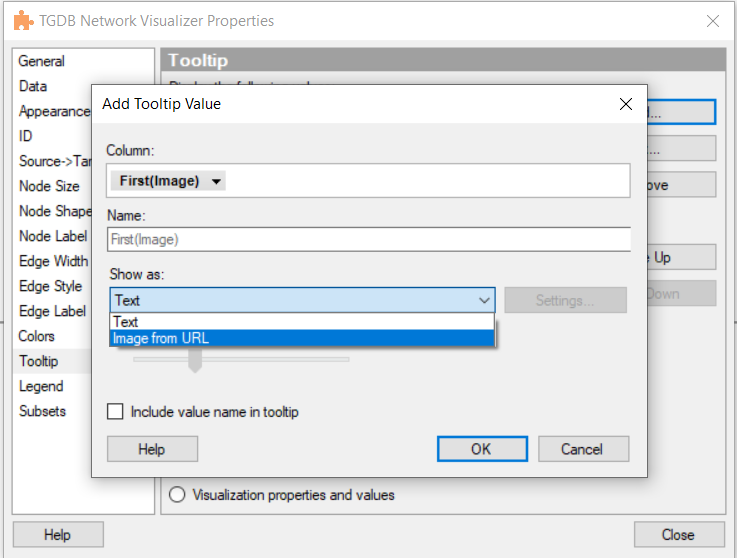
By default all the axes in the Network Visualizer Mod will be selected as tooltip content value. Users can add or remove the values as per preferences.To add a new value, click on Add.
For our example, we will select the Image column. In the Show as section, select the Image from URL option.
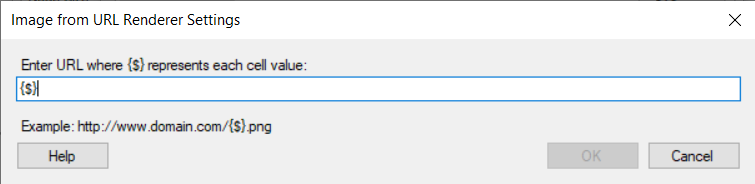
Click on Settings, to specify the Image Renderer settings.
Here, we have specified {$} since we want the renderer to use the entire image URL from the column value. This can be configured according to the value in the Image column. Refer to the Spotfire documentation for more details.
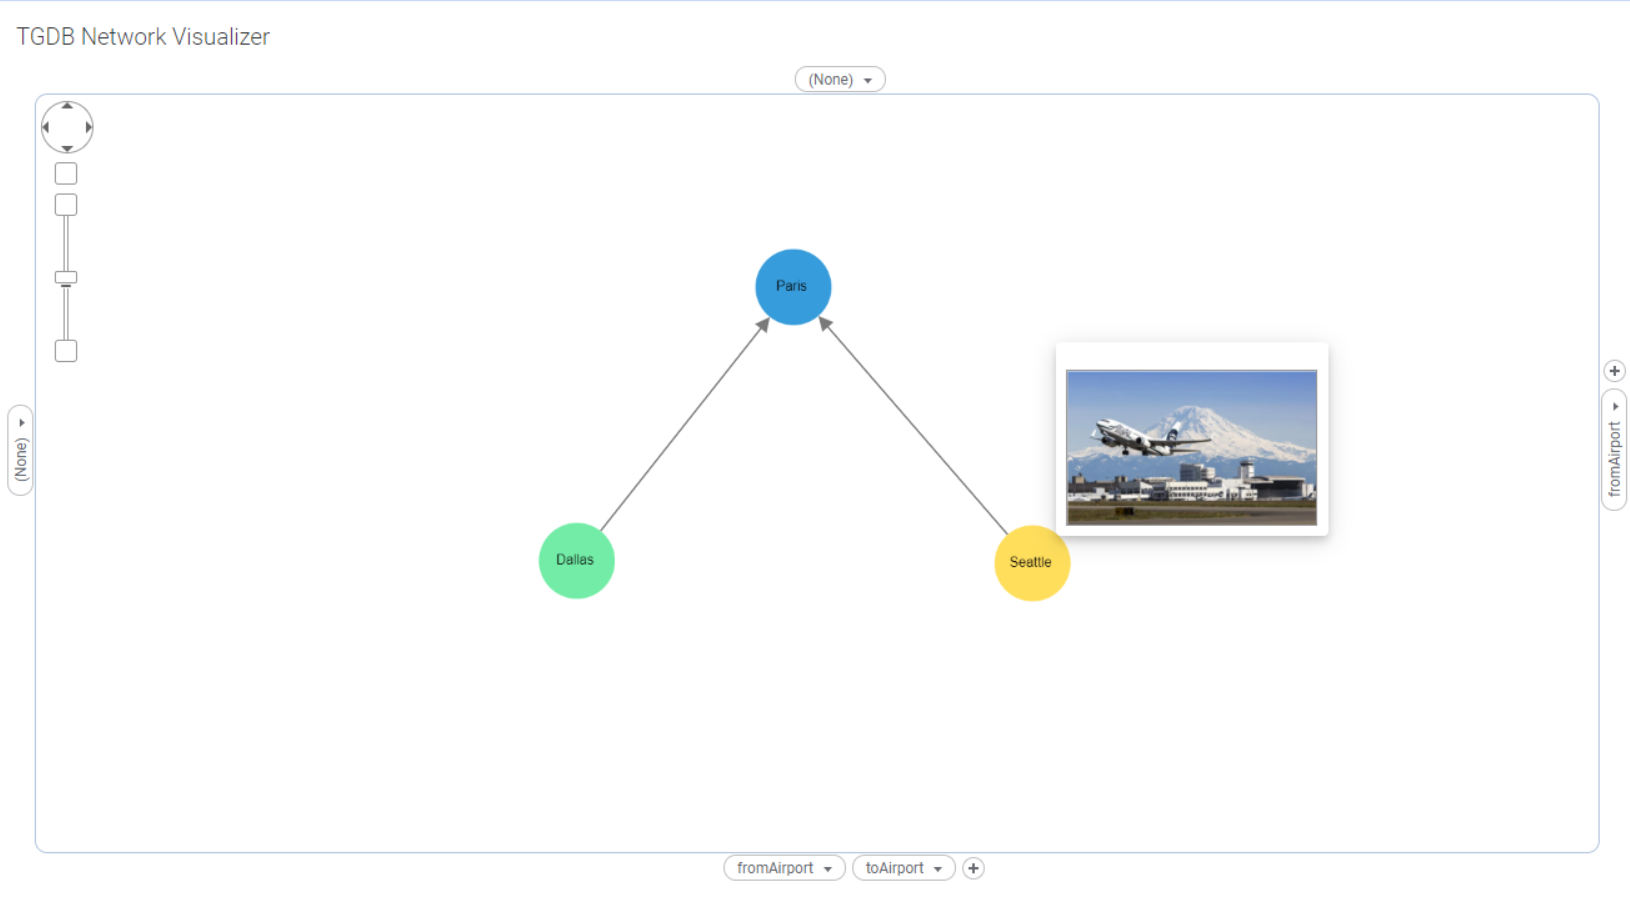
And you are done.
You can now see the Image when you hover on a particular node.
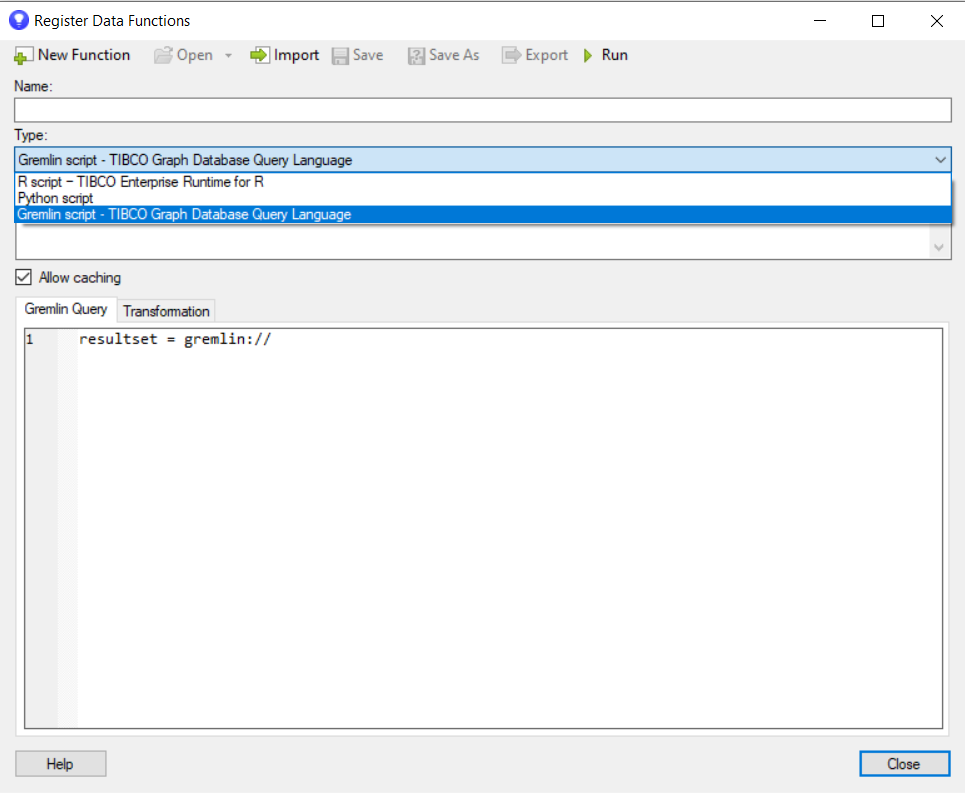
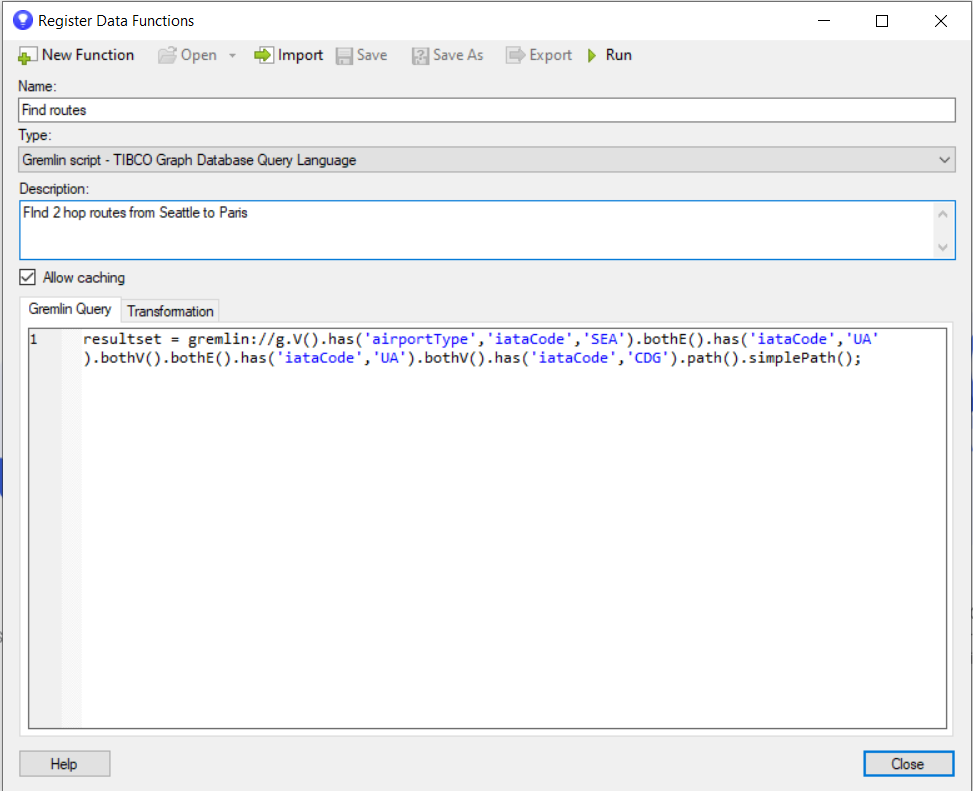
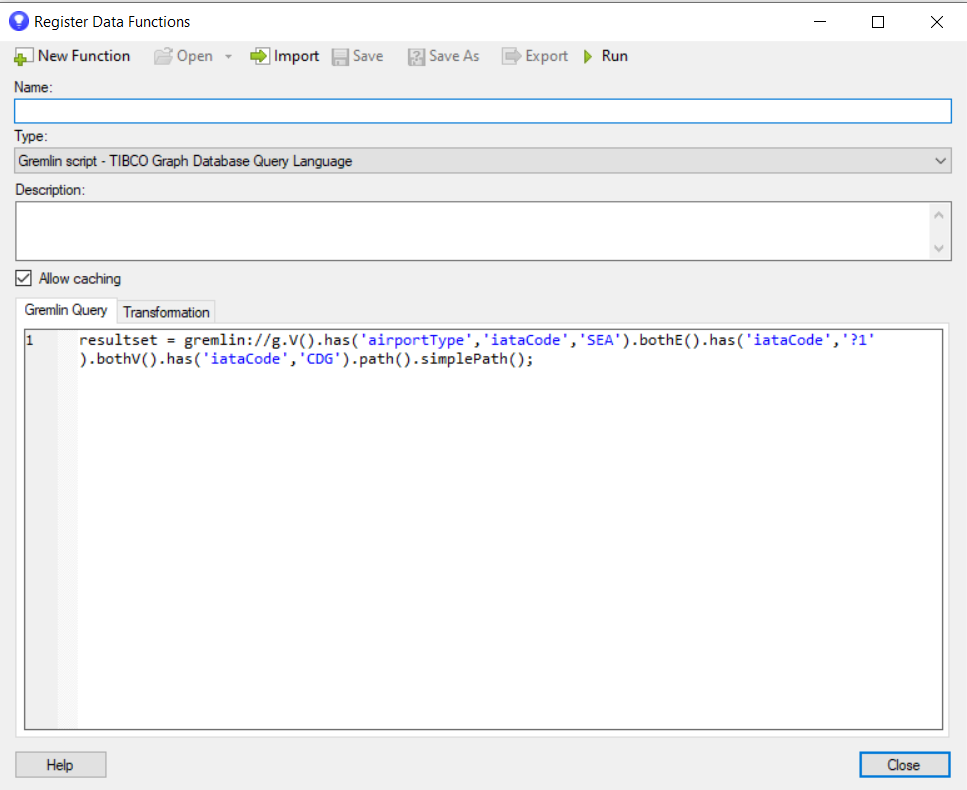
TIBCO Graph Database (TGDB) data function provides a native data function connector to Spotfire. This custom data function allows users to execute parameterized TGDB queries and stored procedures and to convert the query result set from hierarchical format into Spotfire native Data tables. It comes with its own context sensitive and syntax coloring TGDB Query Editor.
It supports both parameterized and non-parameterized TGDB gremlin queries.
For example,
Non parameterized query
g.V().has('airportType','iataCode','SEA').bothE().has('iataCode','UA').bothV().has('iataCode','CDG').path().simplePath();
Parameterized query
g.V().has('airportType','iataCode','SEA').bothE().has('iataCode','?1').bothV().has('iataCode','CDG').path().simplePath();
In the above query, ?1 indicates the parameter. There are multiple options in Spotfire to specify the value for the input parameter such as string value, column from data table, etc.
Operating System | Windows 10 |
Visualization Tool | TIBCO Spotfire Desktop version 11.2.0+ TIBCO Spotfire Analyst version 11.2.0+ |
TGDB | TIBCO(R) Graph Database 3.1.0 and above |
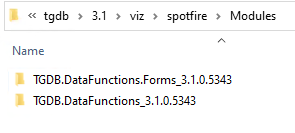
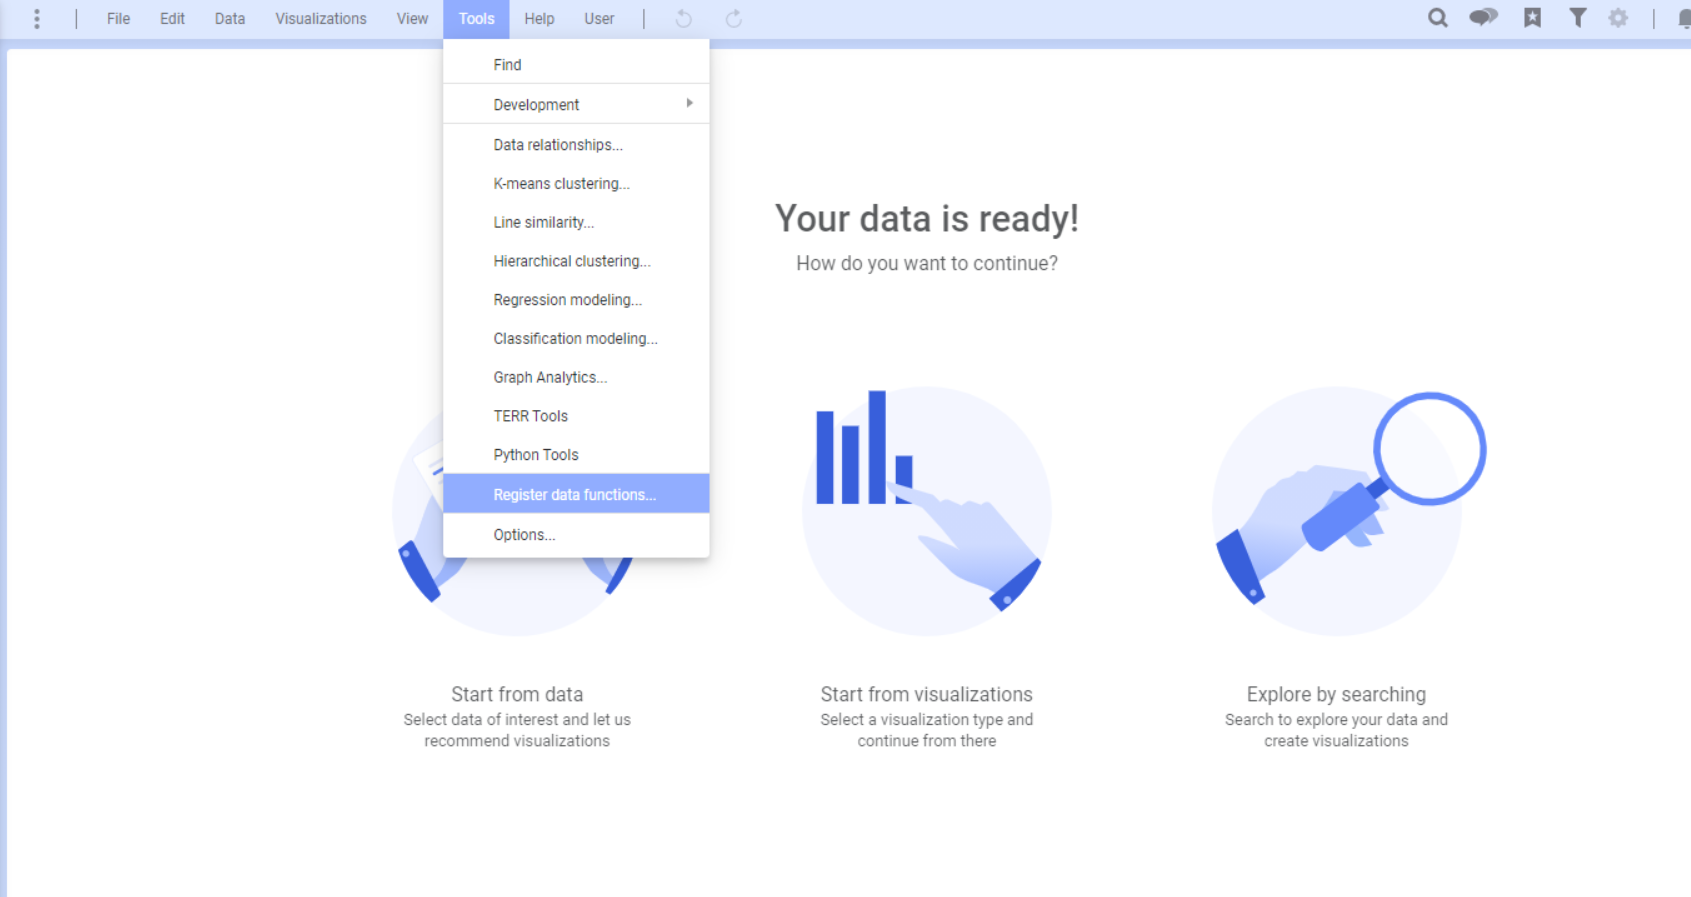
Follow the Spotfire Documentation on how to add a Data Function Connector to your Spotfire Installation:
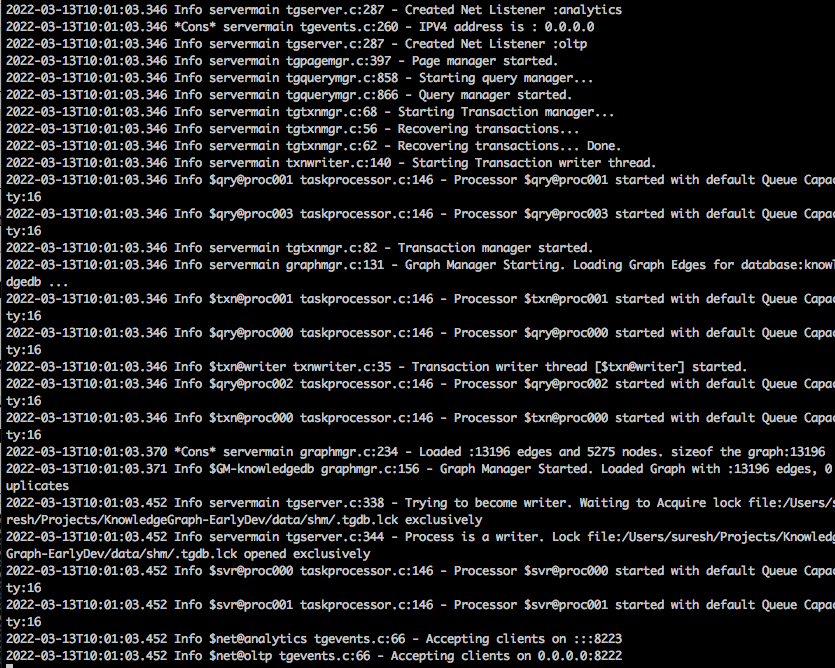
For this task, the reader has installed TIBCO Graph Database 3.1.0, and followed the basic instructions as set in the Getting Started guide:
tgdb -s -c tgdb.conf
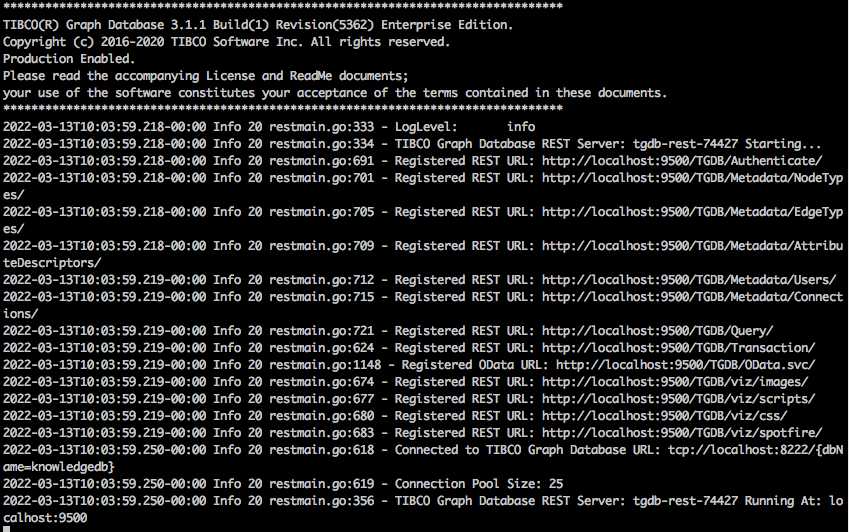
tgdb-rest --dburl tcp://localhost:8222/{dbName=knowledgedb}
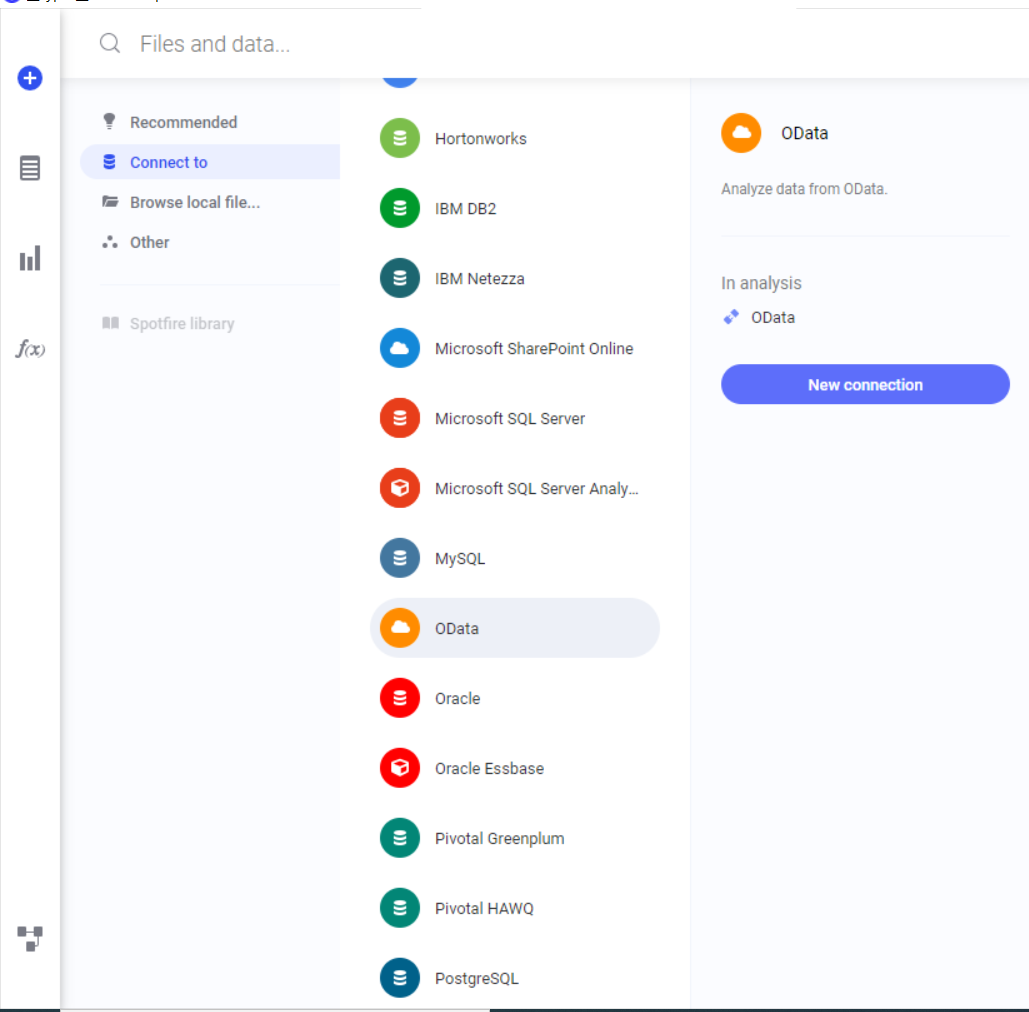
TIBCO Spotfire connects to the TIBCO Graph Database server through the system OData Connector.
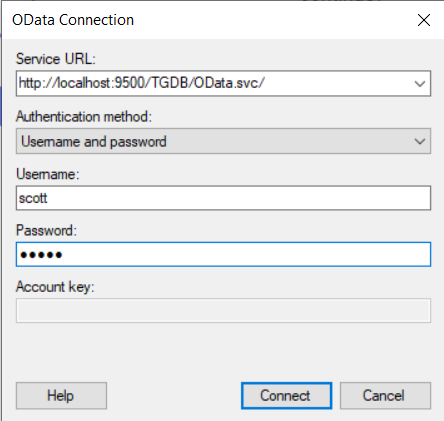
Once connected to the TGDB rest server, start Spotfire Desktop and add a new OData connection as follows:
Service URL : http://localhost:9500/TGDB/OData.svc/
Authentication method : Username and password
Username : A valid username in the database
Password : The password for the user.
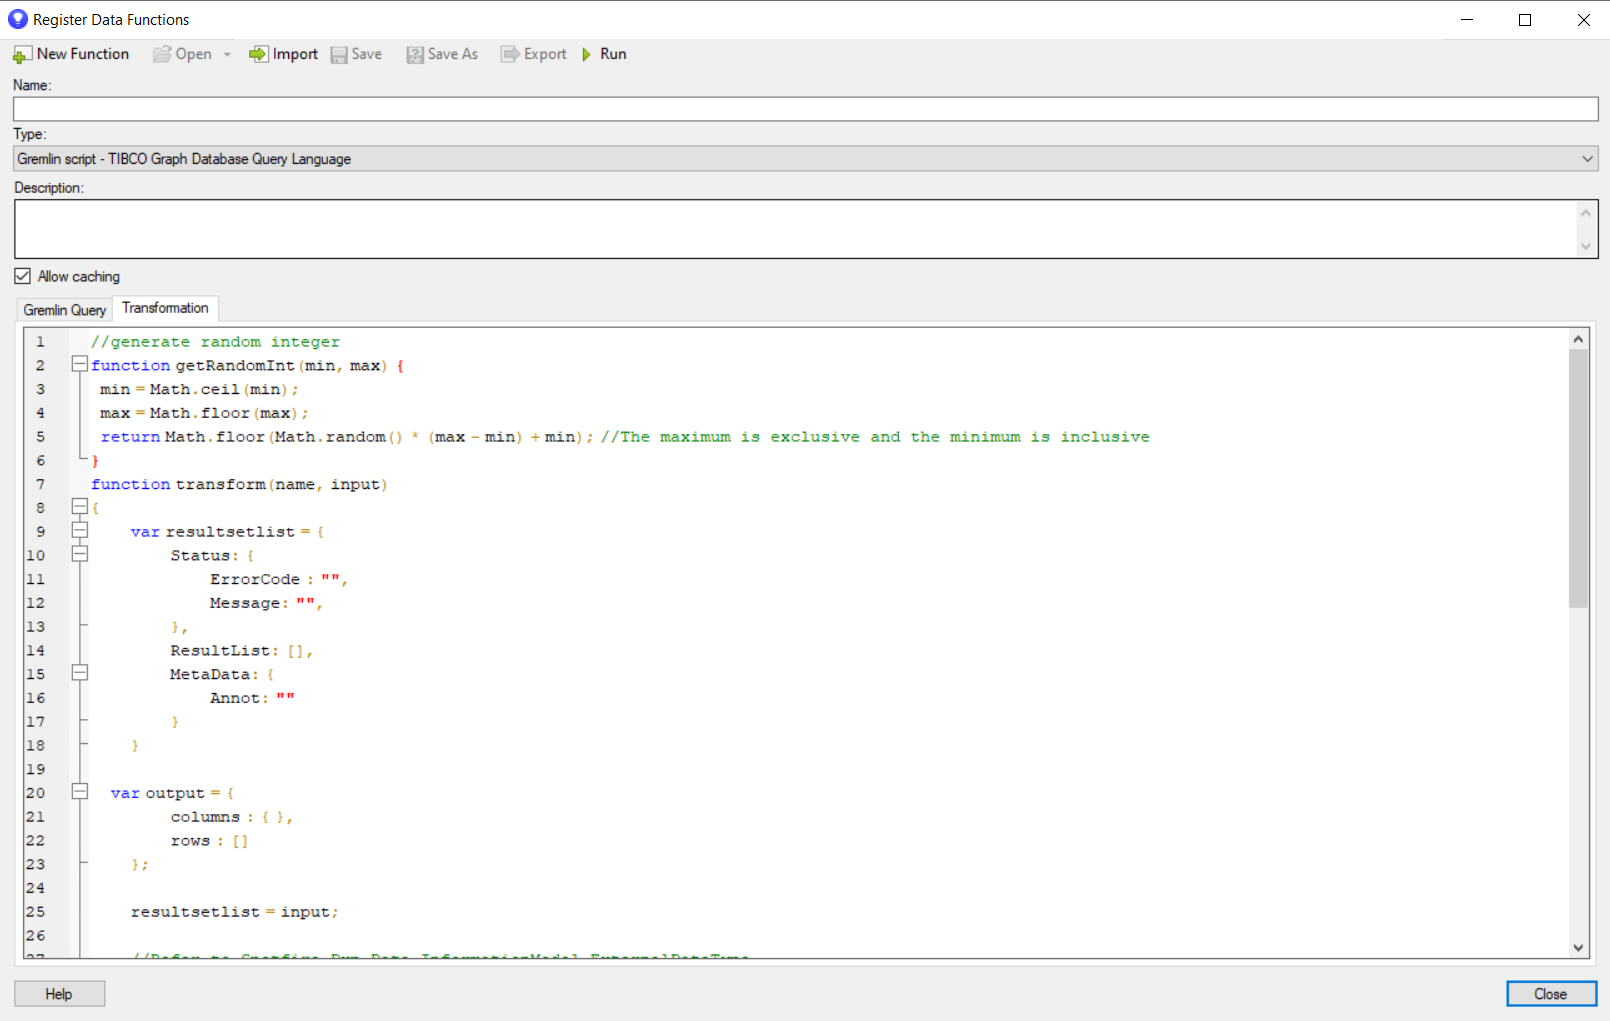
If you have any data transformations to be applied to the query result, you can specify it here as a javascript in the Transformation tab.
In 10 easy steps, we have learned how to use the TGDB Gremlin Query Data Function, execute TGDB gremlin queries in Spotfire and get the results loaded in a Spotfire data table.
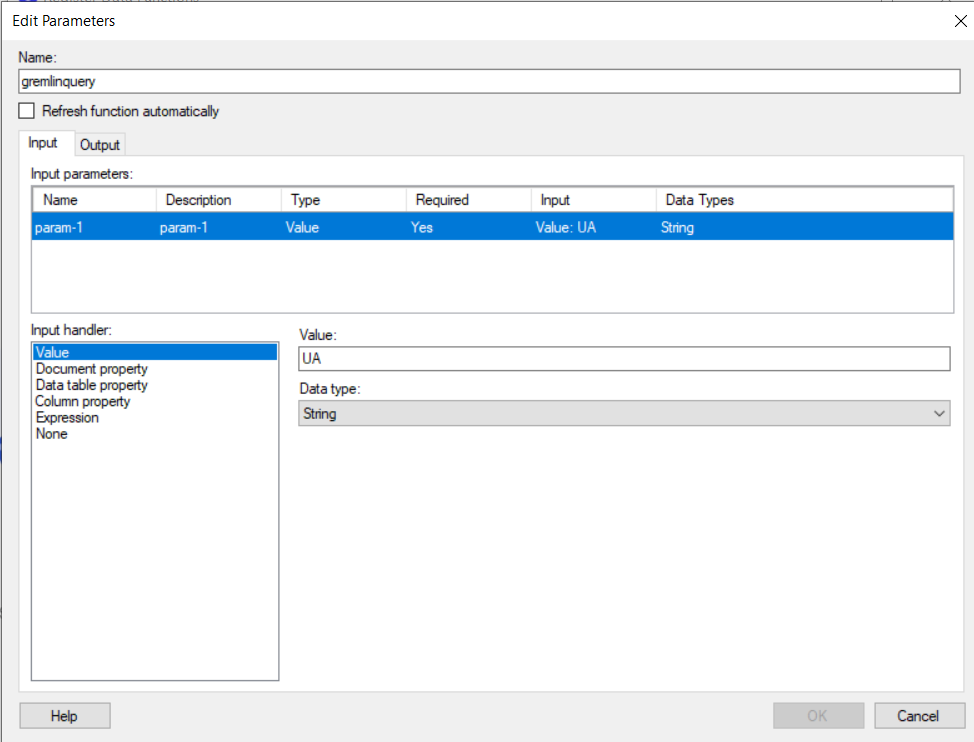
TGDB data function supports parameterized query execution, where one or more attribute values in the gremlin query can be specified as a parameter. The value for these parameters will be substituted at run time during query execution. Here is an example of a parameterized query:
g.V().has('airportType','iataCode','SEA').bothE().has('iataCode','?1').bothV().has('iataCode','CDG').path().simplePath();
Here ?1 is the parameter and its value can be specified as an input parameter to the TGDB gremlin query data function.
If a user wants to specify more than one parameter, it can be specified as ?1,?2… and so on.
For example,
g.V().has('airportType','iataCode','?1').bothE().has('iataCode','?2').bothV().has('iataCode','CDG').path().simplePath();
Here you have different options to specify the value for the input parameters. You can specify it as a String value or a Document Property or a Column property and so on.
Refer to the Spotfire Documentation to know more about these options.
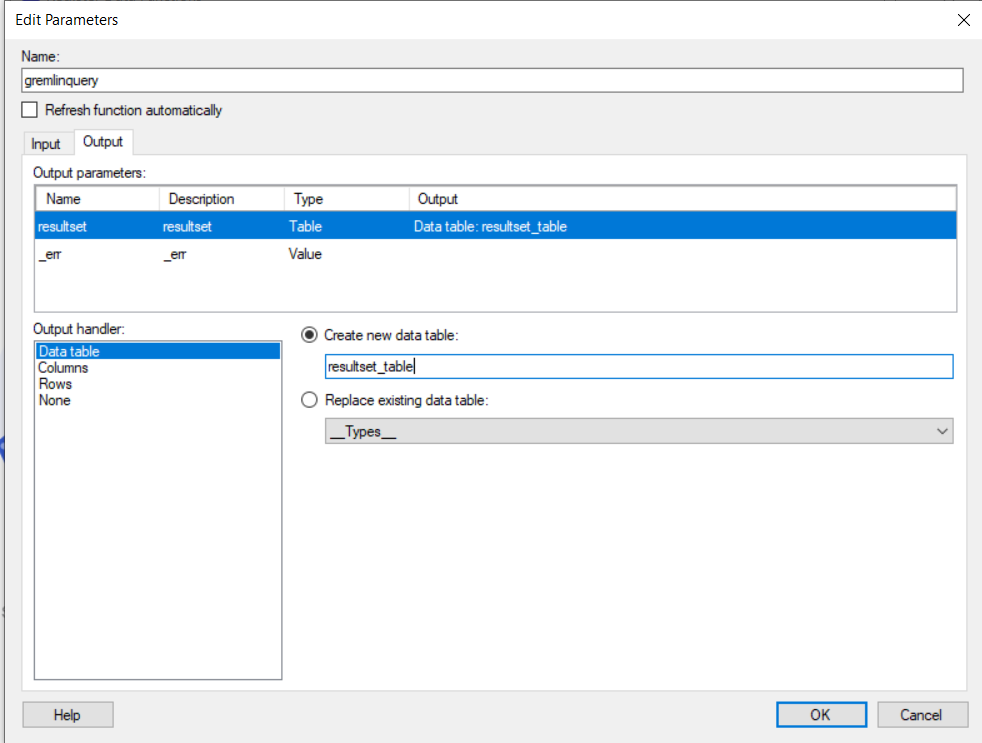
The TGDB gremlin query data function provides an option to specify any transformations to be performed on the output data.When a gremlin query is executed on TGDB server, it returns the query result as JSON which can consist of collection of nodes and/or edges. With the transformation option, the data function can convert this dynamic JSON into the standard JSON that represents the rows and columns of a Spotfire data table. The language used to specify the transformation is javascript.
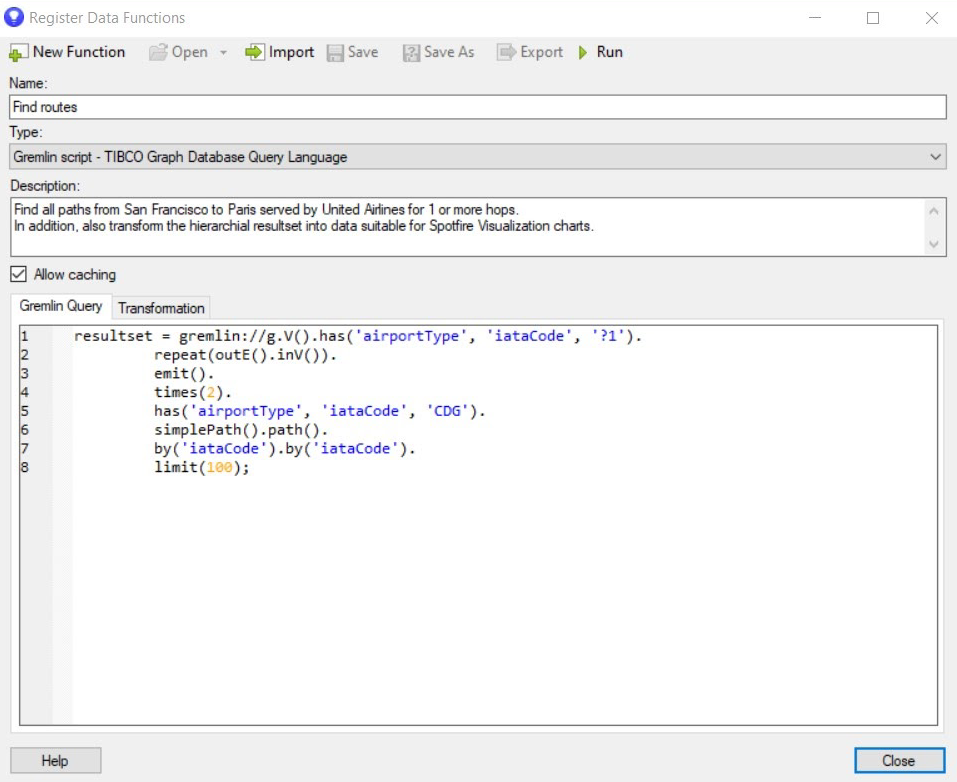
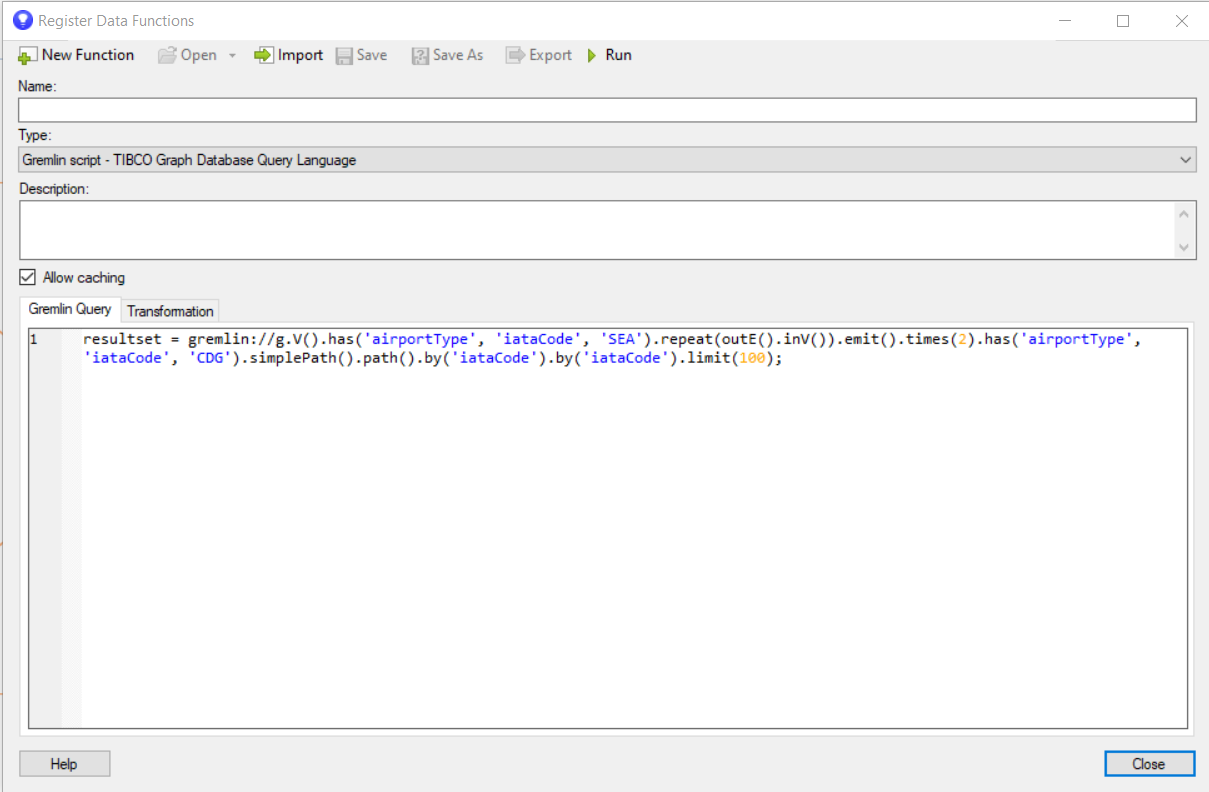
Let’s see a sample query and how to transform the query results.
Query
g.V().has('airportType', 'iataCode', 'SEA').repeat(outE().inV()).emit().times(2).has('airportType', 'iataCode', 'CDG').simplePath().path().by('iataCode').by('iataCode').limit(100);
This query returns all the paths of zero, one or two hop starting from Seattle to Paris.
The result can be represented as an annotation P(s,s,s,s,s) where s stands for a scalar value.
Here is how a sample path will look like
[SEA -> AA -> JFK-> AA -> CDG]
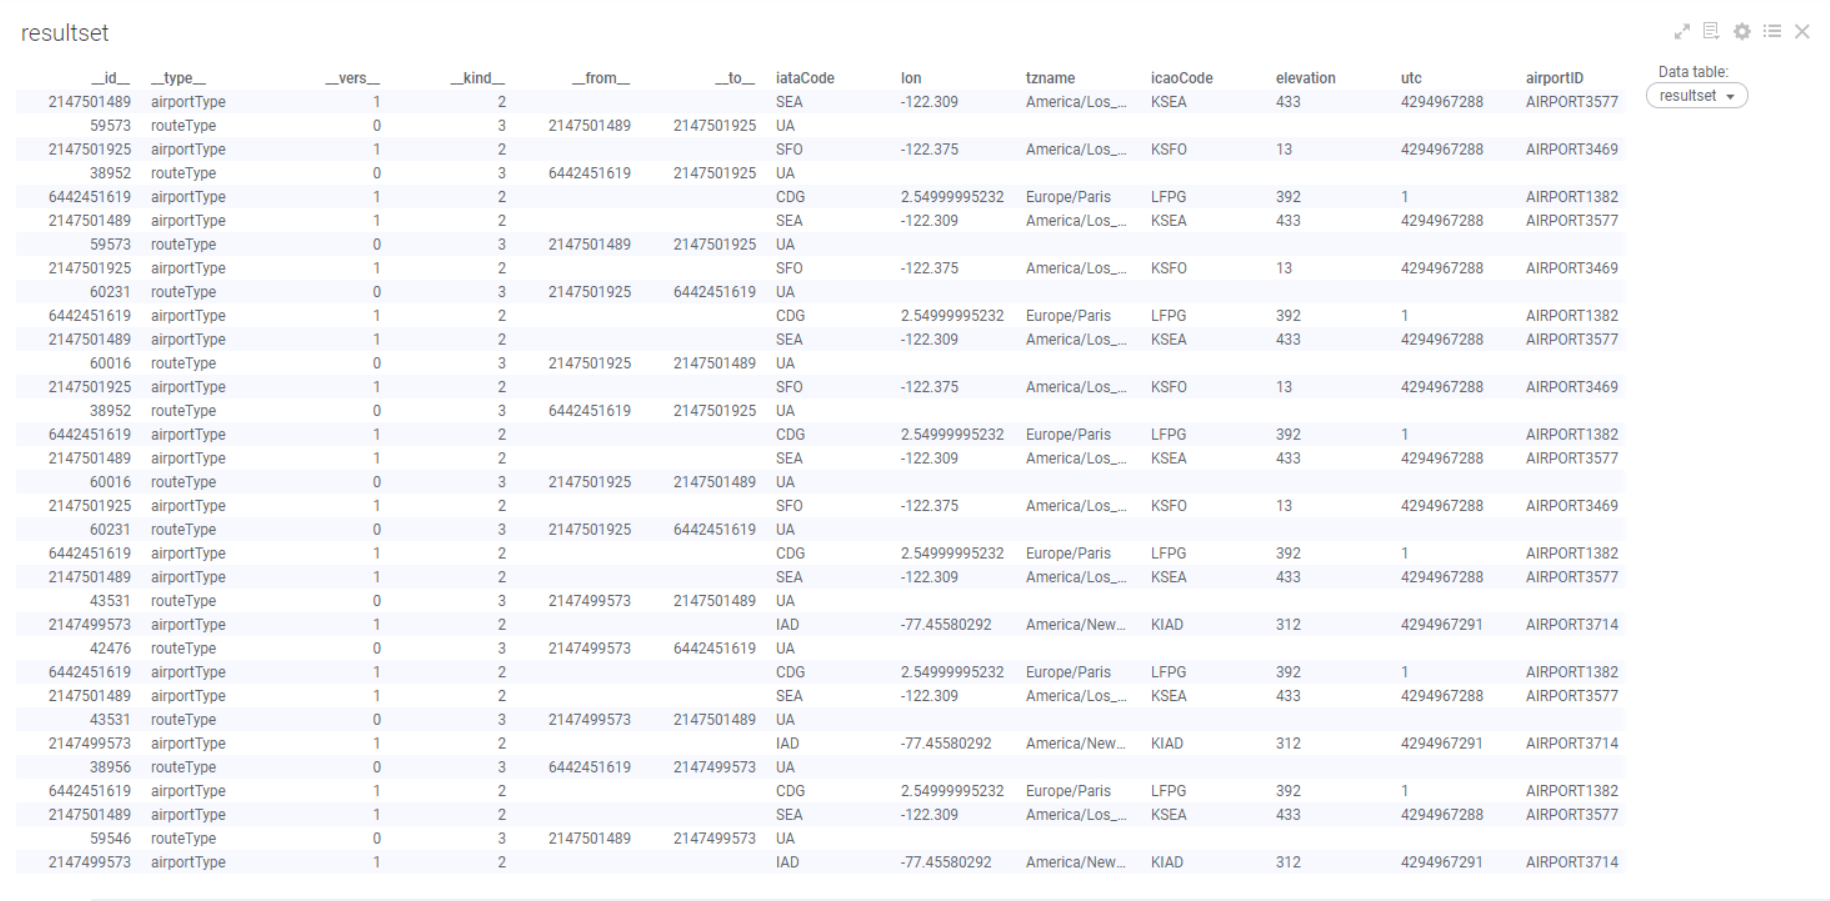
Here is how the query will look in the query console.
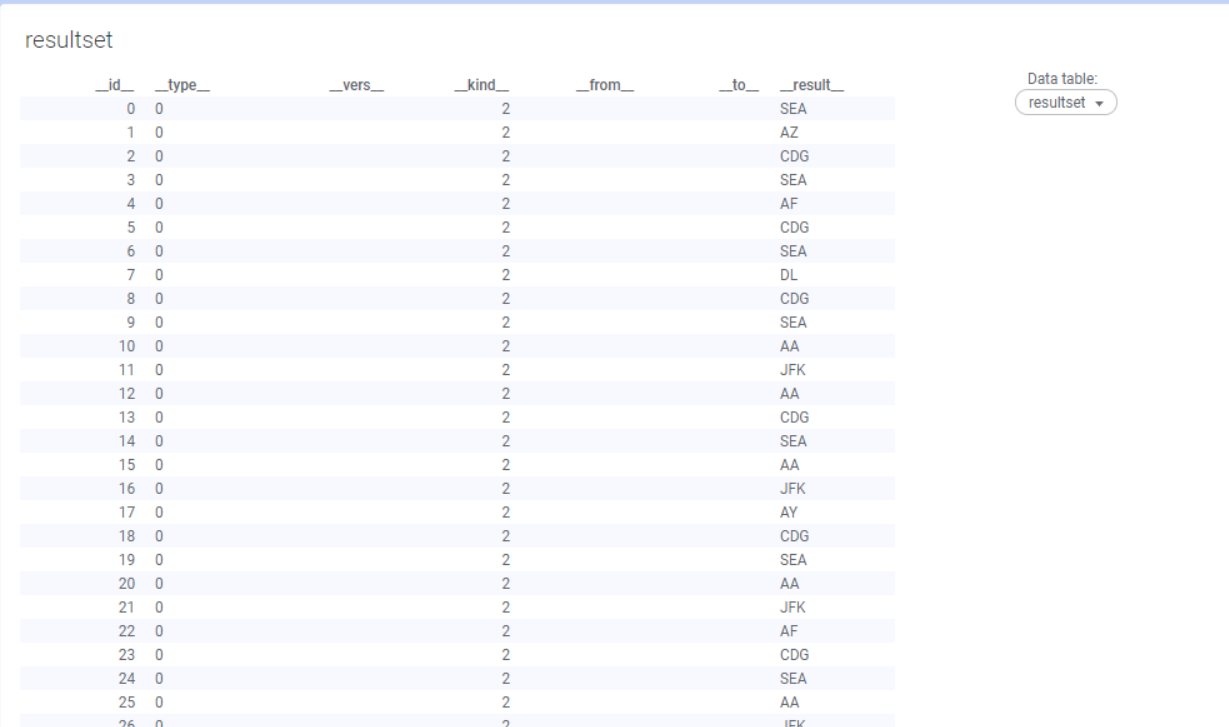
If you run this query, the resultset table would look like as shown below. If you look at rows 9-13, you will notice that it represents one path from Seattle to Paris.
Clearly this result table is not very readable. To solve this problem we can use the data transformation feature provided by TGDB Gremlin query data function.
Let’s use the following sample transformation function which will take the query result we saw earlier and transform it into a table that looks like this.
routeid | from | to | Airline | cost |
1 | SEA | JFK | AA | 100 |
1 | JFK | CDG | AA | 600 |
This table is easily readable and you can clearly identify the individual paths from Seattle to Paris.
The transformation function is written in Microsoft ClearScript language, a javascript-like language. The transformation function takes an input JSON and transforms into an output JSON in tabular format, such as rows and columns. In JSON terms, the output result has the following schema and in ClearScript looks like below:
Output Schema | ||
Name | Type | Description |
columns | object | Describing the metadata for the columns. Each entry is column name and its value is the data type. |
attr1 | int | The value is one of enumerated values of Enum DataTypeMapper. See the Data Type Mapper section. |
attr2 | int | |
⠇ | ||
attrN | int | |
rows | list<row> | List of rows. Each row contains an json object with attr1..attrn and their values. A null value is to skip it. A row is anonymous json object An anonymous row object |
none | row | |
attr1 | The transformed value for attr1… attrn. Its data type was specified in the column definition. | |
attr2 | ||
⠇ | ||
attrN | ||
The interface requirement for the transformation function is shown below:
transform | The name of the function must be called “transform”. There can be other functions too. | |
Parameter Name | Type | Description |
name | string | The name of the gremlin query script data function |
input | json | The output of the query execution.See the REST API Query for the result schema. |
Skeleton interface | function transform(name, input) { var resultsetlist = { resultList: [], MetaData: { Annot: "[[(V,{s,l})]]" } } var output = { columns : { }, rows : [] }; resultlist = input //Transformation code … ⠇ } | |
DataTypeMapper is an enumeration class to help you specify the attribute’s data type. DataTypeMapper is a wrapper around the ExternalDataType enumeration type of Spotfire. For more info refer to Spotfire.Dxp.Data.InformationModel.ExternalDataType. The enumerated values are as below:
Boolean | Boolean value of true or value |
Integer | 32-bit value of integer |
LongInteger | 64-bit value of integer |
Real | 64-bit double value represented as IEEE 754 floating point number |
SingleReal | 32-bit float value |
Currency | Currency number |
Date | Date value of the DateTime. |
Time | Time part |
DateTime | DateTime |
Clob | Character Large Objects such as html, docs, etc… |
Blob | Binary Large Objects such as images, maps, etc… |
function transform(name, input) { var resultsetlist = { Status: { ErrorCode : "", Message: "", }, ResultList: [], MetaData: { Annot: "" } } var output = { columns : { }, rows : [] }; resultsetlist = input; output.columns["routeid"] = DataTypeMapper.LongInteger; output.columns["from"] = DataTypeMapper.String; output.columns["to"] = DataTypeMapper.String; output.columns["airlinecd"] = DataTypeMapper.String; output.columns["cost"] = DataTypeMapper.SingleReal; for (i in resultsetlist.ResultList) { var path = resultsetlist.ResultList[i]; var row = { }; row["routeid"] = i; row["from"] = path[0]; row["airlinecd"] = path[1]; row["to"] = path[2]; row["cost"]= getRandomInt(300,800); output.rows.push(row); if (path.length > 3) { row = { }; row["routeid"] = i; row["from"] = path[2]; row["airlinecd"] = path[3]; row["to"] = path[4]; row["cost"]= getRandomInt(300,800); output.rows.push(row); } } return output; } | function getRandomInt(min, max) { min = Math.ceil(min); max = Math.floor(max); //The maximum is exclusive and the minimum is inclusive return Math.floor(Math.random() * (max - min) + min); } |
Just add the transformation function to the transformation tab. Click on the Gremlin Query tab and follow the rest of the steps as explained in Using TGDB Gremlin Query Data Function point 8 onwards.
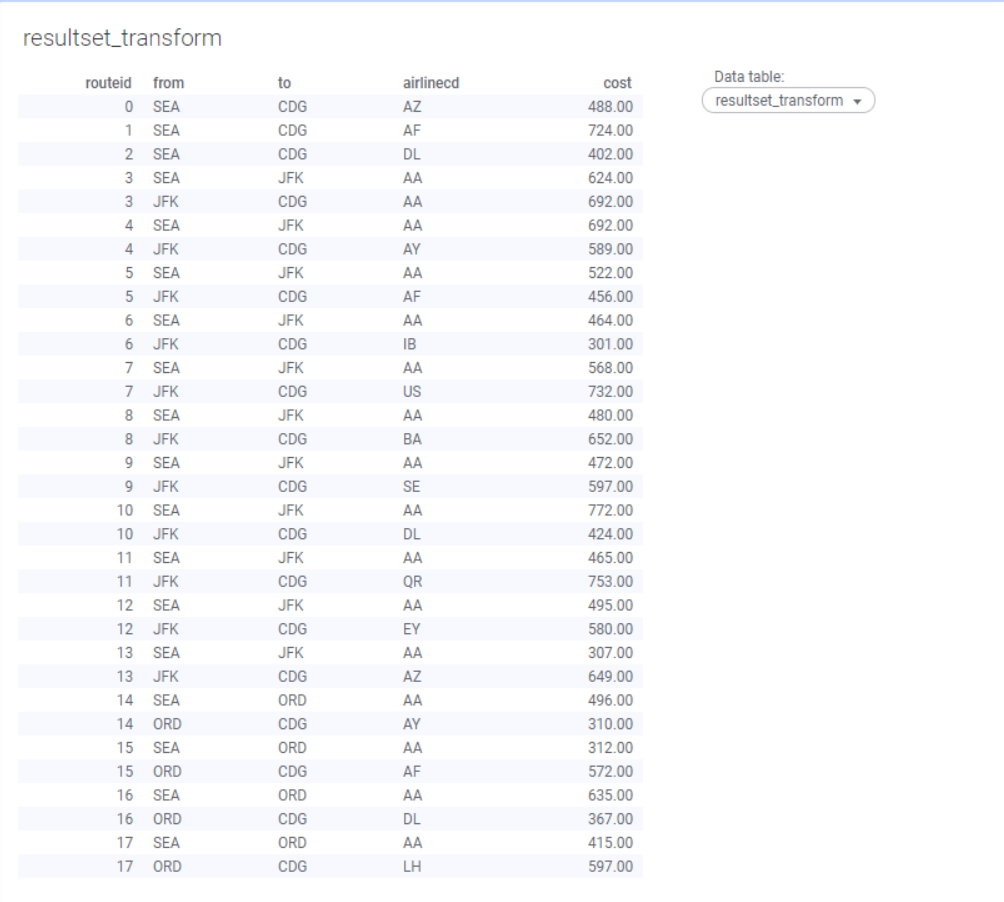
Here is how the Result table would look like:
To conclude, we have successfully transformed the given query results into a more readable and useful data table using the TGDB Gremlin Query Data function.
Using the TGDB Gremlin Query Data Function you can also run TGDB Stored procedures. The Gremlin Query Language can invoke stored procedures using the “execsp” step. You can utilize this step to run stored procedures through the query console in the data function.
Let’s see how to invoke the built-in stored procedure using the TGDB Gremlin Query data function.
Gremlin Query
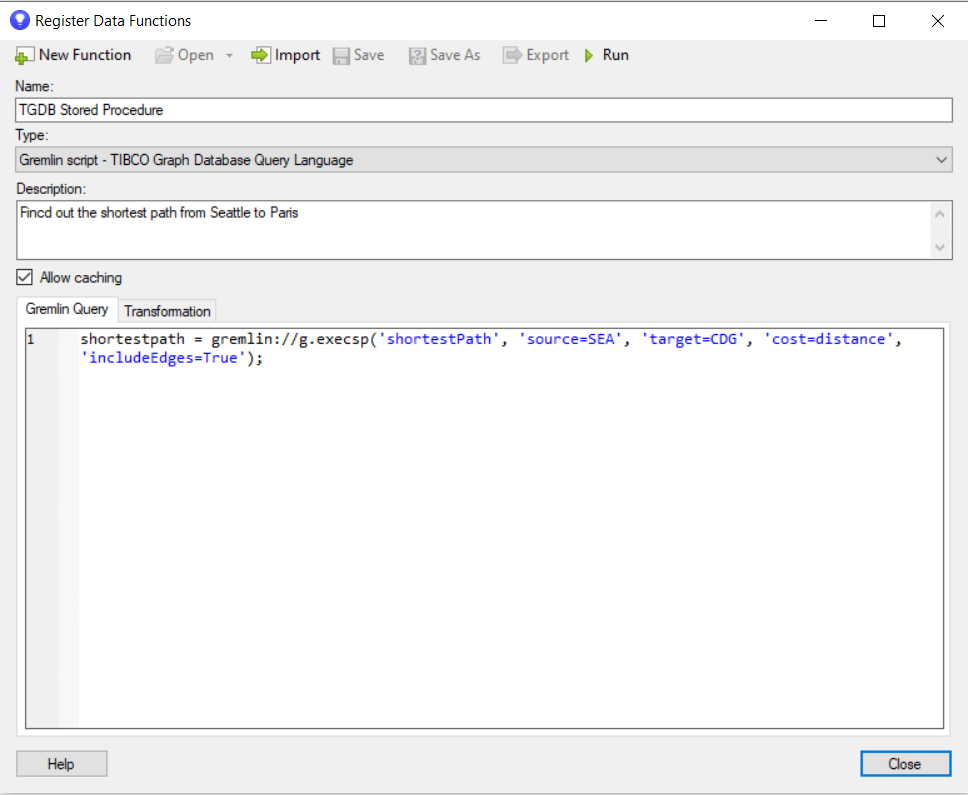
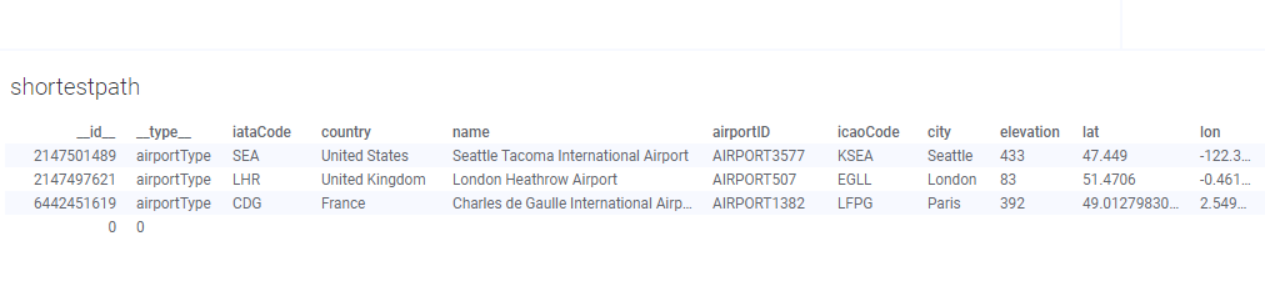
Here is a sample gremlin query that executes the stored procedure called “shortestPath”.
This stored procedure will find out the shortest path from Seattle to Paris and will use distance as a cost metric to do so.
g.execsp('shortestPath', 'source=SEA', 'target=CDG', 'cost=distance', 'includeEdges=True');
As we have already seen in the section Using TGDB Gremlin Query Data Function, run this gremlin query using the TGDB Gremlin Query data function.
Note At the point of release, nested queries are not supported in this version of the product. The workaround would be to write a stored procedure with the input parameters, and the stored procedure internally makes nested queries.
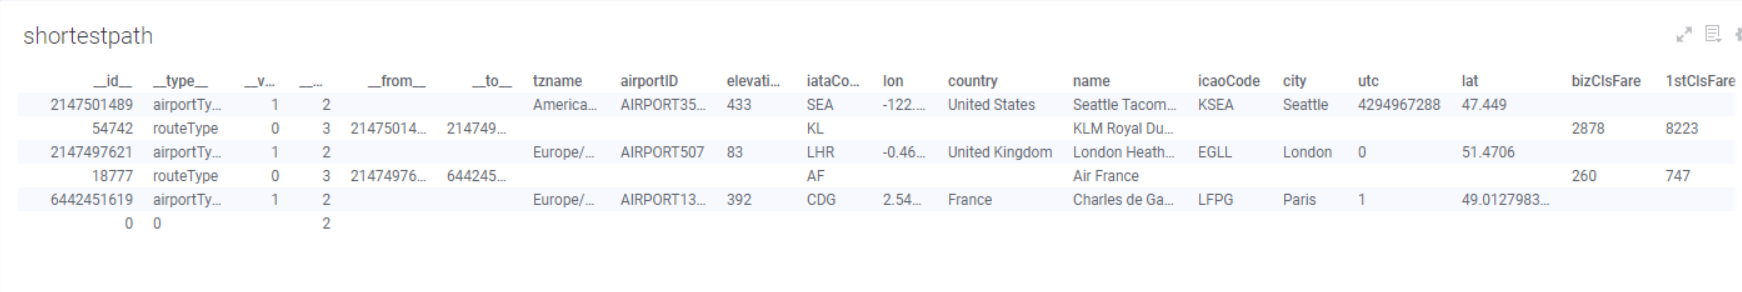
After successful execution, you should be able to see the results in the shortestpath data table.
For more details on Stored Procedures support in TGDB, refer to the TGDB Stored Procedure Guide.
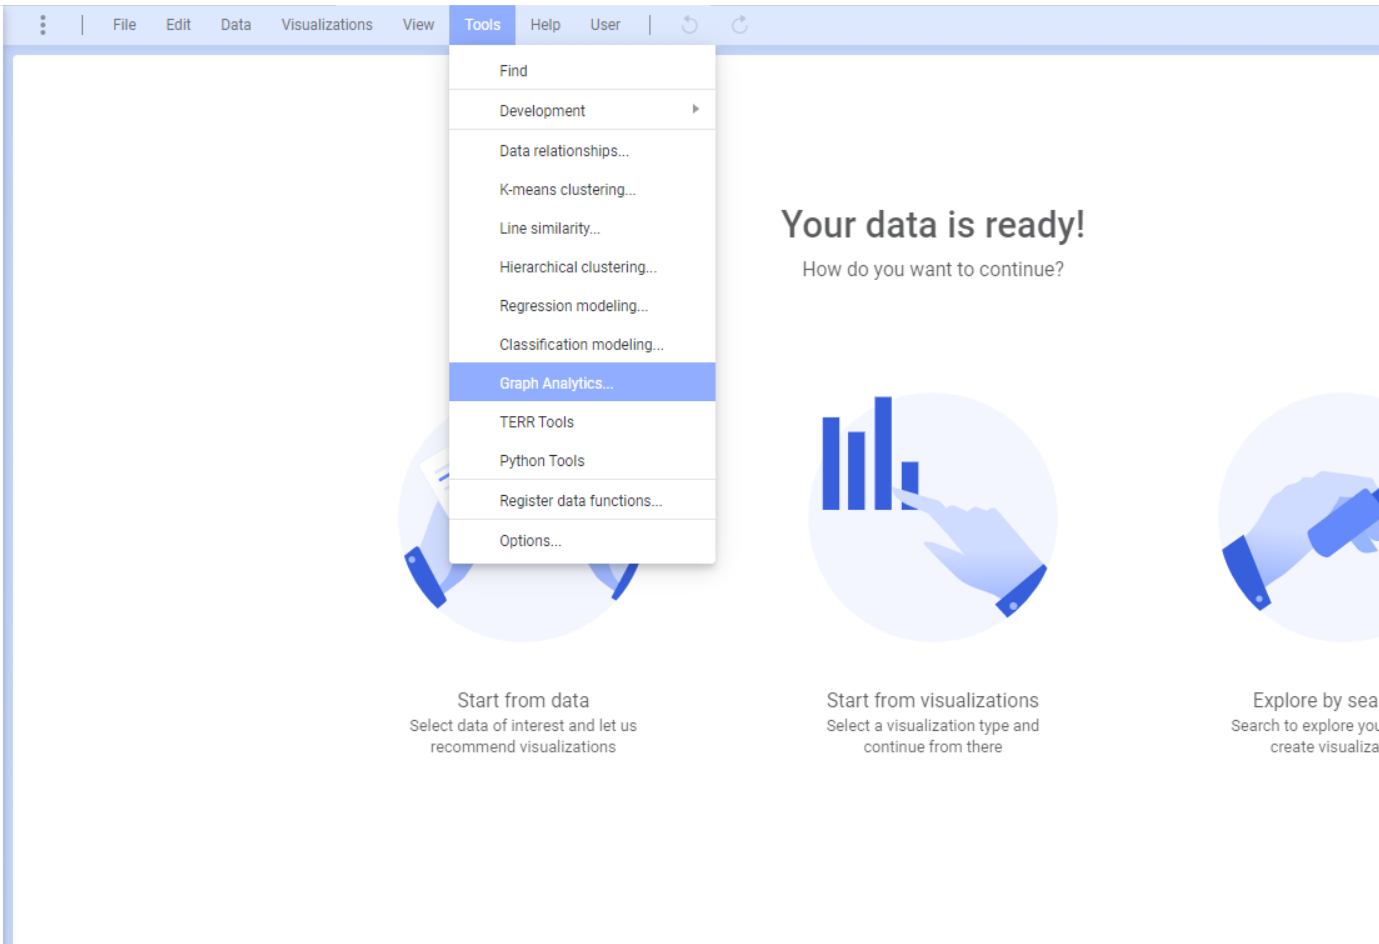
TIBCO Graph Database supports native Graph algorithms via the Graph Analytics Tool in Spotfire for Visual Analytics.These algorithms are classified as below:
For this task, the reader has installed TGDB 3.1 and followed the basic instructions mentioned in points 1- 4 in section Using TGDB Gremlin Query Data Function:
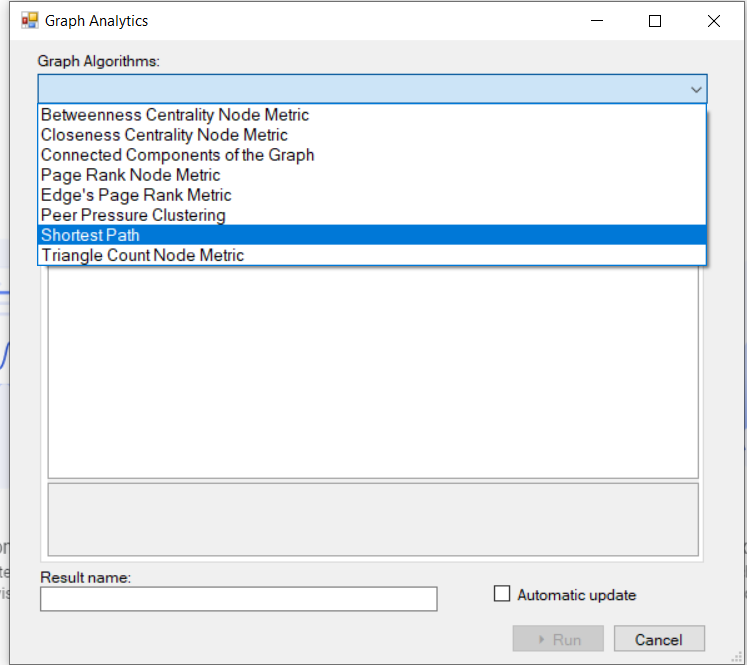
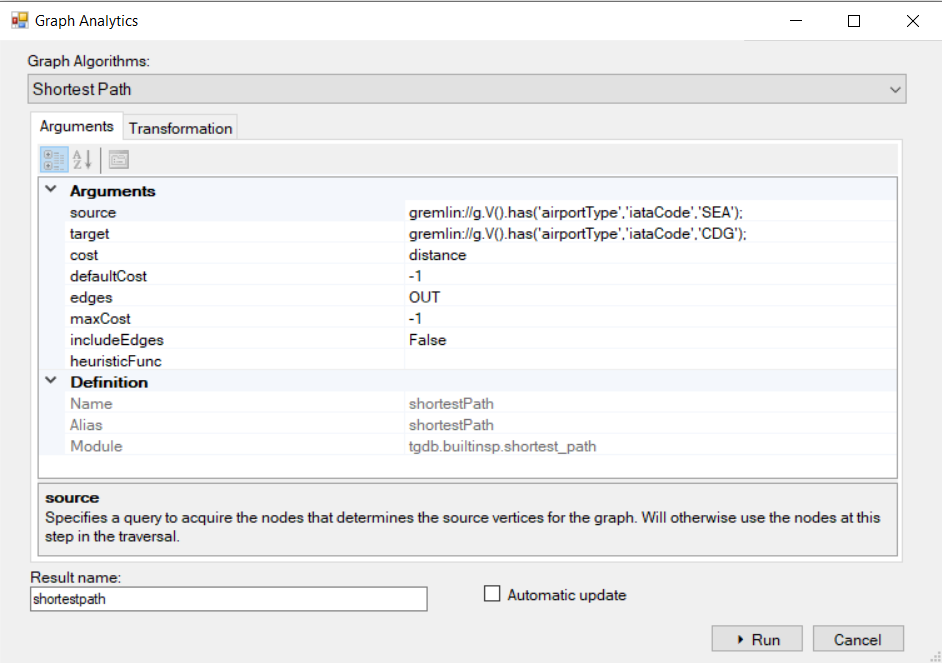
Let’s see how to run the Shortest Path graph algorithm to find out the shortest path from Seattle to Paris with distance as a cost metric.
In 4 easy steps, we have used the TGDB Graph Analytics tool in Spotfire to find the shortest path from Seattle to Paris.
TGDB provides a reference implementation of standard Graph Algorithms as a set of stored procedures for Graph Analytics. They can be executed via the admin console, Java API or Spotfire for Visual Analytics.
For a detailed analysis on Graph Algorithms, please refer to the TGDB Stored Procedure Guide.
For security considerations, please refer to the TGDB REST API Guide.