Creating a Widget to Autoplay Control Values
You can insert a widget on an HTML page to automatically submit values in a control at specific intervals. The control can be linked to a report, chart, or map.
You can enable the autoplay setting for the widget in the Tasks & Animations panel. The widget selected may require the following configurations:
- Setting the timing for the autoplay action to indicate the amount/length of time it should take for a value to change.
- Setting the play interval for a date slider to specify the interval in terms of days, weeks, months, or years.
When the autoplay widget displays, select a control on your page from the drop-down menu in the widget. You can hide the drop-down menu by making a selection or pressing the Esc key. When you press the play button in the autoplay widget, the value in the selected control changes based on the specified time interval.
You can also create an autoplay control that is the sole input control for a parameter, unassociated with any control on the page. This is called a virtual control. You can do this in one of two ways:
- When creating a control using the New Parameters dialog box, in the Create control column drop-down menu, click Virtual.
- In the Parameters view tab, right-click a control object, point to Set Control Type, and click Virtual Control.
You must create a task to display a virtual control autoplay widget using the Tasks & Animations panel.
Create a Widget to Autoplay Control Values
- Procedure
- Create an XML parameter report to use for the map. For example:
TABLE FILE BASEAPP/WF_RETAIL_LITE
SUM
WF_RETAIL_LITE.WF_RETAIL_SALES.REVENUE_US
WF_RETAIL_LITE.WF_RETAIL_SALES.GROSS_PROFIT_US
BY WF_RETAIL_LITE.WF_RETAIL_GEOGRAPHY_STORE.COUNTRY_NAME
WHERE WF_RETAIL_LITE.WF_RETAIL_TIME_SALES.TIME_DATE_YEAR_COMPONENT EQ &TIME_DATE_YEAR_COMPONENT.(FIND WF_RETAIL_LITE.WF_RETAIL_TIME_SALES.TIME_DATE_YEAR_COMPONENT,
WF_RETAIL_LITE.WF_RETAIL_TIME_SALES.TIME_DATE_YEAR_COMPONENT IN
baseapp/wf_retail_lite|FORMAT=YYMDy).Sale,Year:.QUOTEDSTRING;
ON TABLE SET PAGE-NUM NOLEAD
ON TABLE SET ASNAMES ON
ON TABLE NOTOTAL
ON TABLE PCHOLD FORMAT XML
ON TABLE SET HTMLCSS ON
END
- Create a new HTML page.
- In the Objects group, click ESRI Map to draw an Esri map component on the canvas.
- From the Requests & Data Sources panel, select the New drop-down arrow, point to External Request, and then click WebFOCUS Procedure.
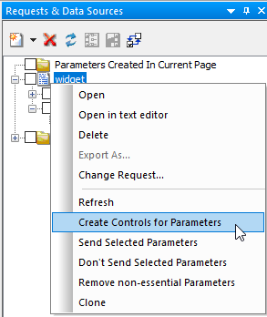
- Right-click the report in the Requests & Data Sources panel and click Create Controls for Parameters, as shown in the following image.
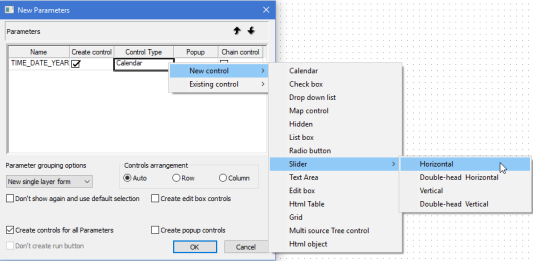
- In the New Parameters dialog box:
- In the Control Type column, right-click Calendar.
- Select New control.
- Select Slider.
- Select Horizontal.
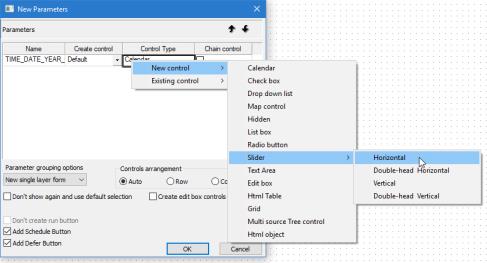
The populated New Parameters dialog box is shown in the following image.
Note: To create a control as only an autoplay widget, without an associated control on the page, open the drop-down menu in the Create control column and click Virtual.
- Click OK.
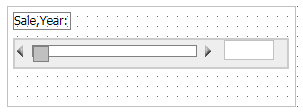
The horizontal slider is added to the HTML page, as shown in the following image.
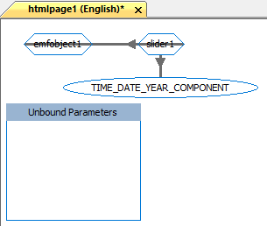
- Select the Parameters tab and drag the slider over emfobject1 (the map object) to draw a line to symbolize the chaining of objects. The arrow indicates the direction of the chaining, as shown in the following image.
- Return to the Design tab, select the map object, and open the Settings panel.
- On the Settings panel:
- Select Layer1.
- For the Request value, select the name of the XML report.
- For the Geographic Role, select Country (Name).
- For the Column(s) that match the role, select COUNTRY_NAME.
- For the Layer Attributes, select REVENUE_US and GROSS_PROFIT_US.
- For the Enable Popups attribute, select On.
- For the Default Extent attribute, select On.
- For the Use attribute, select Color.
- For the Using Field attribute, select GROSS_PROFIT_US.
- For the Color Scheme attribute, select red to green.
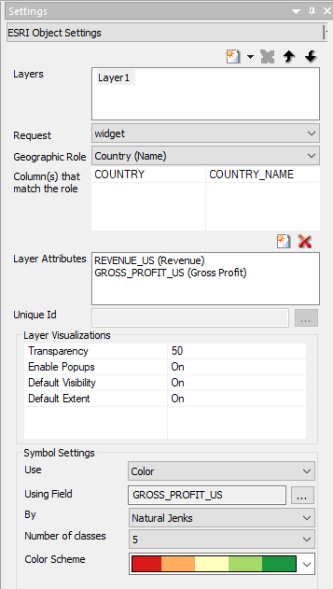
The populated Settings panel is shown in the following image.
- Multi-select the Submit, Reset, and Schedule buttons in the form and delete them, as shown in the following image.
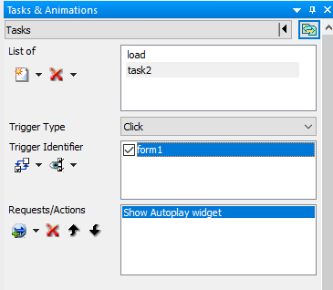
- On the Tasks & Animations panel:
- Delete task 2 and task 3.
- Create a new task.
- For the Trigger Type attribute, select Click.
- Select the form of the control to add the Trigger Identifier.
- Select form1.
- For the Requests/Actions attribute, select Show Autoplay widget.
The populated Tasks & Animations panel is shown in the following image.
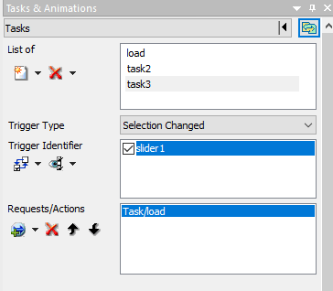
- On the Tasks & Animations panel:
- Create a new task.
- For the Trigger Type attribute, select Selection Changed.
- Select the form of the control to add the Trigger Identifier.
- Select slider1.
- For the Requests/Actions attribute, select Execute Task and then select load.
The populated Tasks & Animations panel is shown in the following image.
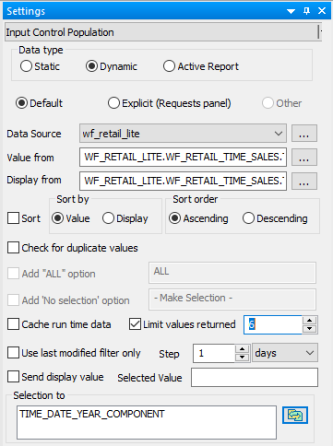
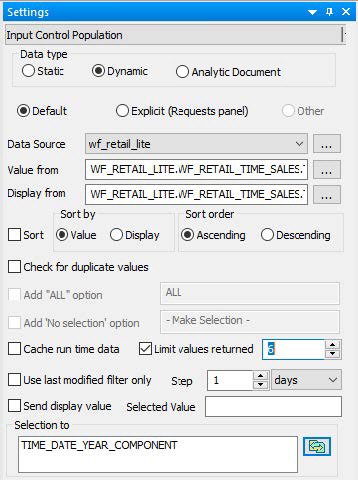
- Select the slider control in the HTML canvas.
- On the Settings panel, select Limit values returned and change the value to 6, as shown in the following image.
- Select the map component in the HTML canvas.
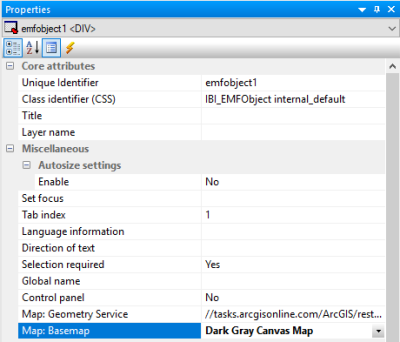
- From the Properties panel, change Map: Basemap to Dark Gray Canvas Map, as shown in the following image.
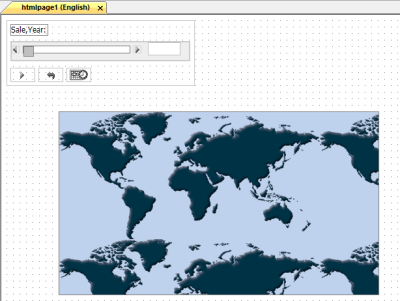
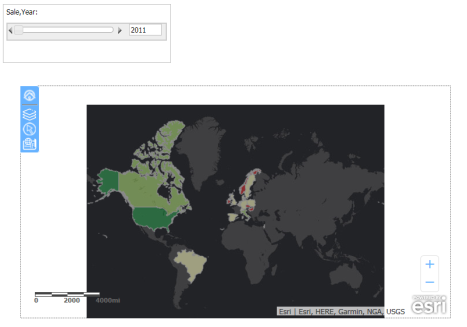
- Run the HTML page, as shown in the following image.
- Click within the slider form.
- Select Sale,Year: from the Autoplay Widget drop-down list, as shown in the following image.
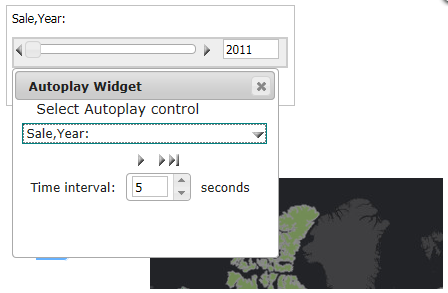
- Drag to reposition the widget, so that it does not cover the map or the control.
- Click the play button.
Note: As the slider moves automatically, from year to year, the map is refreshed with the data for the corresponding year.