MULTIREGRESS: Creating a Multivariate Linear Regression Column
MULTIREGRESS derives a linear equation that best fits a set of numeric data points, and uses this equation to create a new column in the report output. The equation can be based on one or more independent variables.
The equation generated is of the following form, where y is the dependent variable and x1, x2, and x3 are the independent variables.
y = a1*x1 [+ a2*x2 [+ a3*x3] ...] + b
When there is one independent variable, the equation represents a straight line. When there are two independent variables, the equation represents a plane, and with three independent variables, it represents a hyperplane. You should use this technique when you have reason to believe that the dependent variable can be approximated by a linear combination of the independent variables.
Create a Multivariate Linear Regression Column
MULTIREGRESS(input_field1, [input_field2, ...])
where:
Are any number of field names to be used as the independent variables. They should be independent of each other. If an input field is non-numeric, it will be categorized to transform it to numeric values that can be used in the linear regression calculation.
Creating a Multivariate Linear Regression Column
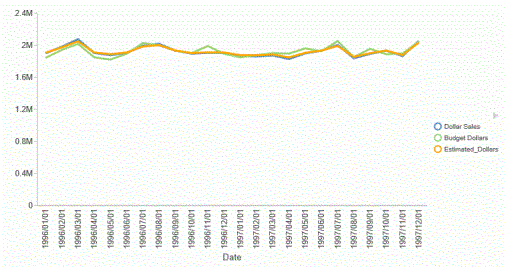
The following request uses the DOLLARS and BUDDOLLARS fields to generate a regression column named Estimated_Dollars.
GRAPH FILE GGSALES

SUM BUDUNITS UNITS BUDDOLLARS DOLLARS

COMPUTE Estimated_Dollars/F8 = MULTIREGRESS(DOLLARS, BUDDOLLARS);

BY DATE

ON GRAPH SET LOOKGRAPH LINE

ON GRAPH PCHOLD FORMAT JSCHART

ON GRAPH SET STYLE *

INCLUDE=IBFS:/FILE/IBI_HTML_DIR/ibi_themes/Warm.sty,$

type=data, column = n1, bucket = x-axis,$

type=data, column= dollars, bucket=y-axis,$

type=data, column= buddollars, bucket=y-axis,$

type=data, column= Estimated_Dollars, bucket=y-axis,$

*GRAPH_JS

"series":[

{"series":2, "color":"orange"}]

*END

ENDSTYLE

END
The output is shown in the following image. The orange line represents the regression equation.
