Formatting a Series
A series is a measure field that is included in a chart. You can format a series in a variety of ways. For example, you can change the color of a series, add a trendline to a series, or change the appearance of markers on a series.
You can access the full set of formatting options on the Series tab and Field tab. For more information, see Series Tab and Field Tab.
You can also access a subset of frequently-used options by right-clicking a series element on a chart to open a menu of those options.
Tip: The options that you see on the menu depend on the type of chart that you are creating. For example, the Series Type option would not appear on the menu for a pie chart, but it would appear for a bar, line, and area chart.
Associated Dialog Boxes
Whether you access series options from the ribbon or the shortcut menu, you are presented with a dialog box of options. The following dialog boxes are commonly used for formatting a series:
- Format Series
- Edit Title
- Traffic Light Condition
For Instructions on how to open these dialog boxes, see the procedures in Using Series Properties.
Format Series Dialog Box
The Format Series dialog box contains options to format the fill and border of each series on a chart. To access this dialog box, on the Series tab, in the Style group, click Style.
The Format Series dialog box contains the following tabs:
- Fill
- Border
- Effect (for HTML5 charts only)
Use the Fill tab to modify the color of a chart series.
The Fill tab is shown in the following image.
The Fill tab contains the following options:
- No fill. Select this option to remove the color from the series.
- Solid fill. Select
this option to display the Color and Transparency options.
- Color. Click this icon to open the Color dialog box, where you can select a color for the series.
- Transparency. Move the slider to make the bands opaque (0%) or transparent (100%). The default is 0%.
- Gradient fill. Select
this option to display the direction of the gradient, the color
pattern of the gradient, and the degrees of transparency for the
two colors that make up the gradient. A gradient is a smooth color
transition or blending of one color to another. The number of colors
to use in a gradient is defined by the stop or pin elements.
- Direction. Select from this drop-down menu to set the direction of the gradient fill. For example, Gradient right or Gradient left.
Use the Border tab to specify a border for a chart series.
The Border tab is shown in the following image.
The Border tab contains the following options:
- Show Border Color. Select this option to show a border color around each series.
- Border Color. Click this icon to open the Color dialog box, where you can select a color for the border.
Use the Effect tab to specify styling and shadowing options for HTML5 charts.
The Effect tab is shown in the following image.
Note: This tab only displays when working with HTML5 charts.
The Effect tab contains the following options:
- Riser Style. Use this drop-down menu to select a riser style. Options include: None, Bevel, Cylinder, Darken, Inverted Darken, Lighten, and Inverted Lighten.
- Show Shadow. Select this option to set a shadow.
Edit Title Dialog Box
To edit the title of a series, right-click a series on the canvas, and click Change Title. The Edit Title dialog box contains a text field in which you can type the title for a series on a chart. Click OK and the title appears on the chart.
If you have specified an amper (&) variable in your title while working in Live Preview, _FOC_NULL displays to indicate that an amper variable that has not been evaluated. It indicates that the value will be evaluated at run time.
Traffic Light Condition Dialog Box
The Traffic Light Condition dialog box contains fields for adding new conditional styling or modifying existing conditional styling by applying a traffic light color to the selected field.
The Traffic Light Condition dialog box is shown in the following image.
The Traffic Light Condition dialog box contains the following fields.
- Relational Operators. Select from this drop-down menu to set the relational operator. For example, Equal to.
- Type/Value. Click
this unlabeled field to open a dialog box that contains the following
fields:
- Type. Opens a drop-down menu of the following values Constant and Field. Select Constant to enter a constant value. Select Field to open a visual display of the fields in your data source.
- Value: Enables you to specify a value based on the Type
that you select.
Note: If you are creating a Traffic Light condition on a full date field, the Value field will have a calendar icon adjacent to it. You can use this icon to select a date using a calendar control.
- Get Values. Select a value option from this drop-down list. For example, All or First.
The Traffic Light Condition dialog box contains the following buttons:
- Selected Condition. Click this icon to select a condition to work on.
- New. Creates a new rule.
- Delete. Deletes a rule.
- Color. Opens the Color dialog box.
- Drill Down. Opens
the Drill Down dialog box, where you can drill down to a webpage
or a URL using Multi Drill functionality. Specify the following:
- URL of the webpage or location of the report
- An alternate comment
- Target (New Window, Same Window, a value that you enter)
- Parameters that you want to use (Name, Value)
Note: In WebFOCUS InfoAssist, when the output destination is set to Single Tab or New Tab, the drilldown target cannot be displayed in the same window so a new window will be generated. When the report is run outside of WebFOCUS InfoAssist the same window setting will be respected.
Series Elements Shortcut Menu
When you right-click a series, a menu of options opens. The menu contains options that are available on the Field and Series tabs.
The menu options are described in the following table. The table provides links to the sections of this document in which those options are also discussed.
|
Option |
Description |
|---|---|
|
Filter Values |
Enables you to create or modify a WHERE statement, using the Filter dialog box. With a WHERE statement, you select only the data that you want to display, and exclude unwanted data. For information on filtering your data, see Data Tab and Field Tab. |
|
Sort |
Enables you to sort the series in either ascending or descending order. |
|
Visibility |
Controls the display of the selected series (field) on a chart. The value Hide suppresses the display of the series, and the default value Show displays the series. For instructions, see Hide a Field in a Series. |
|
Change Title |
Enables you to edit the title of the selected series. In the Edit Title dialog box, type the new title in the Enter Title field, and click OK. For instructions, see Change the Title of a Series. |
|
Edit Format |
Enables you to change the format of a field. This includes field type, display options, field length, and the specification of applicable decimal points. For more information, see Changing a Field Format. Note: Any changes to the format of a field will be reflected in the tooltip for charts at run time, as well as for visualizations at design and run time. |
|
Series Type |
Changes the chart type of the selected series to bar, line, or area. The option None (default) returns the series to the chart type that was in effect before you changed it. This option applies to bar, line, and area chart types only. For instructions, see Change the Type of a Series. |
|
Series Color |
Enables you to specify the color of the selected series, using the Color dialog box. For more information, see Using the Color Dialog Box. |
|
More Style Options |
Opens the Format Series dialog box. For more information, see Format Series Dialog Box. |
|
Data Labels |
Controls the display of data labels (values) on the selected series. The default value Hide suppresses the display of labels, and the value Show displays labels. This option does not apply to the gauge chart type. For instructions, see Show and Hide Data Labels. |
|
Color Mode |
Controls how color is applied to a series (measure field) on a chart. The possible settings are By Series (default) and By Group. For example, assume that there is only one series on a sample bar chart. The By Series setting applies the same color to all the bars in the series. The By Group setting applies a different color to each bar. For instructions, see Control the Color Mode. |
|
Add Trendline |
Draws a line on a chart to indicate a statistical trend. This option does not apply to the pie, funnel, 3D, gauge, or stock chart type. For an example of a chart with a trendline, see Add a Trendline. |
|
Drill Down |
Opens the Drill Down dialog box, where you can configure a hyperlink or a drill-down procedure for the selected field. Clicking that field in the report output, at run-time, redirects you to the URL you specified or executes the indicated procedure. |
|
More |
Contains the Aggregation Functions, Traffic Light Conditions, and Missing options. Aggregation Functions assign an aggregation value to a numeric measure field in a report. For instructions, see Display Aggregations on Measure Data. Traffic Light Conditions enables you to specify the color of numeric measure fields in the output, depending on conditions that you set. You can use the Traffic Light Condition dialog box to specify the conditions and colors. For instructions, see Apply Traffic Light Conditions With Drill-Down to a Numeric Measure Field (By Constant) and Apply Traffic Light Conditions With Drill-Down to a Numeric Measure Field (By Field). The Missing option allows you to show or hide fields with no value. |
|
Delete |
Removes the selected series from the report and updates the Live Preview accordingly. |
Using Series Properties
The following sections contain procedures for customizing a series.
Select a Series
- Procedure
- Create a chart.
- On the Series tab, in the Select group
drop-down menu, select the Series that you want to customize.
The Series appears in the drop-down menu field.
Format the Fill and Border of a Series
- Procedure
- Create a chart.
- Open the
Format Series dialog box in one of the following ways:
Ribbon: On the Series tab, in the Style group, click Style.Shortcut Menu: Right-click a series on the chart, and click More Style Options.
The Format Series dialog box opens.
- Use the
fill and border options to format the series.
For more information, see Format Series Dialog Box.
- Click OK to
close the dialog box.
The Format Series dialog box closes. The series fill and border are formatted accordingly.
- Click Run to generate the report.
Enhancing Series Using the Series Tab
The Properties group contains commands for enhancing charts, such as changing the type or adding a trendline, for the selected series.
Change the Type of a Series
- Procedure
- Create a bar, line, or area chart.
- Access the
list of series types in one of the following ways:
Ribbon: On the Series tab, in the Properties group, open the Type drop-down menu.Shortcut Menu: Right-click a series on the chart, and point to Series Type.
- Select the
type that you want the series to become.
The chart contains the new series type.
Add a Trendline
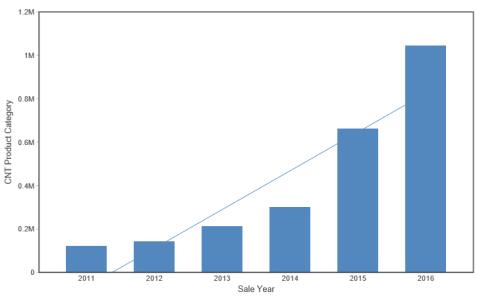
A trendline is a line that is drawn over the plot area of a chart or visual to show the pattern of data points. The pattern reveals a statistical trend. In particular, the slope of the trendline, which is calculated by subtracting and dividing two different x, y coordinate values, is a value that indicates the rate at which the y value of a line rise or falls as the x value increases. Once the slope of your chart or visual is determined, you can further extrapolate your results and gain further insight into your data.
Note: The mathematical equation for the selected trendline option is only available in Chart mode. It is not available in Visualization mode.
- Procedure
- Create a chart or visual.
- Access the
menu of trendline types in one of the following ways:
Ribbon: On the Series tab, in the Properties group, open the Trendline drop-down menu.Shortcut Menu: Right-click a series on the chart or visual, and point to Add Trendline.
- Select the type of trendline that you want to display.
The trendline appears on the canvas.
- Optionally, to display the mathematical equation for the selected trendline
option, on the Series tab, in the Properties group,
click Equation.
The following image shows a trendline that appears with the Linear option.
Formatting Charts Using the Series Tab
The Series tab contains options for formatting charts.
Apply Smooth Line Effect to a Line Chart
- Procedure
- Create a line chart.
- Select a series on the line chart.
- On the Series tab,
in the Line group, click Smooth Line.
The Smooth Line effect is applied to the series.
Hide a Series Line Between Markers
- Procedure
- Create a line chart.
- Select a series on the line chart.
- On the Series tab, in the Series group drop-down menu, select the series that you want to hide.
- In the Line
Group, click Connect Lines.
The series line between the markers disappears.
To make the series line reappear, click Connect Lines again.
Change the Appearance of a Marker
Markers are used to display points of data on a line chart. They are also used in the legend to identify the data that is on the chart. The different marker shapes distinguish one series from another.
- Procedure
- Create a line chart.
- Select a series on the line chart.
- On the Series tab, in the Line group, click Marker to open a drop-down menu of options.
- From the
Marker drop-down menu, select the marker shape. For example, Diamond
or Hourglass.
The markers are formatted.
The following image shows a triangle marker for gross profit data and a star marker for revenue data.
Expand Pie Slices
- Procedure
- Create a
pie chart.
- On the Series tab,
in the Select group, from the drop-down menu, select one
of the following:
All Series expands all slices out from the center of the pie.A specific series expands that particular slice out from the center of the pie.
- In the Pie
group, click Expand.
The pie expands accordingly.
Hide a Pie Slice
- Procedure
- Create a pie chart.
- On the Series tab,
in the Select group, from the drop-down menu, select the
series that you want to hide. Then, in the Pie group, click Hide.
The slice is hidden.
Filter Values in a Series
- Procedure
- Create a chart.
- Select a series on the chart.
- Open the
Filter dialog box in one of the following ways:
Ribbon: On the Field tab, in the Filter group, click Filter.Shortcut Menu: Right-click a series, and click Filter Values.
The Filter dialog box opens.
- Select values for values and prompts.
- Click OK to
close the dialog box.
The series values are filtered.
Sort the Fields in a Series
- Procedure
- Create a chart.
- Select a series.
- Sort the
series in one of the following ways:
Ribbon: On the Field tab, in the Sort group, click Up to sort the series values from smallest to largest, or click Down to sort the series values from largest to smallest.Shortcut Menu: Right-click a series on the chart, and point to Sort, and then Sort again. Click Ascending to sort the series values from smallest to largest, or click Descending to sort the series values from largest to smallest. Select Limit to open a list of values to display for a sort group.
The chart appears with the series sorted accordingly.
Hide a Field in a Series
- Procedure
- Create a chart.
- Hide a field
in a series in one of the following ways:
Select the field in the Query pane.Right-click the field in the chart.Ribbon: Select the field in the Query pane or by right-clicking it in the chart. On the Field tab, in the Display group, click Hide Field. Click Hide Field again to make the series reappear.Shortcut Menu: Right-click a series in the Query pane, or in the chart, point to Visibility, and then click Hide. Right-click the same series, point to Visibility, and then click Show to make the series reappear.
The field is hidden.
Display Aggregations on Measure Data
You can display numeric measure data using a variety of aggregation values.
For more information, see Missing Data in a Chart.
- Procedure
- Create a chart.
- Open the list of Aggregation options in one of the following ways:
Ribbon: On the Field tab, in the Display group, click Aggregation.Shortcut Menu: Right-click a series, point to More, and then Aggregation Functions.
- Select an
aggregation function.
The aggregation function is applied to the series.
Note: If you change the Measure (Sum) Query field container in the Query pane from Sum to Print, Count, or List, the change overrides all assigned aggregation values.
Display Aggregations on Dimension (Non-Numeric) Data
You can use various aggregations when working with dimension (non-numeric) fields in a chart, including Count, Count Distinct, and Percent of Count. The Count aggregation counts the number of occurrences of a field. Count Distinct counts the number of distinct values within a field. Percent of Count computes a field percentage, based on the number of instances found. When a dimension (non-numeric) field is placed in the Vertical Axis field container, it is converted to a Count field. You can subsequently change the aggregation to Count Distinct or Percent of Count.
- Procedure
- Create a chart.
- Convert a dimension (non-numeric) field into a Count field by placing it in the Vertical Axis field container.
- Select the series on which to perform an aggregation.
- Open the list of Aggregation options in one of the following ways:
Ribbon: On the Field tab, in the Display group, click Aggregation.Shortcut Menu: Right-click a series, point to More, and then click Aggregation Functions.
- Select an aggregation function.
The aggregation is applied to the series.
Apply Traffic Light Conditions With Drill-Down to a Numeric Measure Field (By Constant)
- Procedure
- Create a chart.
- Open the
Traffic Light Condition dialog box in one of the following ways:
Ribbon: In the Query pane, select a field, and then on the Field tab, in the Display group, click Traffic Lights.Shortcut Menu: Right-click a series on the chart, point to More, and then click Traffic Light Conditions.
The Traffic Light Condition dialog box opens. For more information, see Traffic Light Condition Dialog Box.
- From the Relational Operators drop-down menu below the field name, select a relational operator. For example, Equal to.
- In the field
to the right of the Relational Operators drop-down menu, click the
down arrow for the Type drop-down menu.
The Type dialog box opens.
- In the Type dialog box, select Constant.
- Enter a
value in the Value field, or
- From the Get Values drop-down menu, select one of the following values All, First, Last, Minimum, Maximum, From File. The value that you select appears in the Get Values field.
- Select the value in the Get Values field. The value that you selected appears in the Value field.
- Click OK.
The value that you selected appears in the field to the right of the operator drop-down menu.
- Click the Color button.
The Color dialog box opens.
- Select a color.
- Click OK.
The color appears in the Preview box.
- Click the Drill
Down button.
The Drill Down dialog box opens.
- In the Drill
Down dialog box, specify each of the following:
Drill down to a report or a webpageURL of the webpageAn alternate commentTarget (New Window, Same Window)Parameters that you want to use (Name, Value)
- Click OK to close the dialog box.
- Click the New button to set traffic light conditions for additional fields.
Apply Traffic Light Conditions With Drill-Down to a Numeric Measure Field (By Field)
- Procedure
- Create a chart.
- Open the
Traffic Light Condition dialog box in one of the following ways:
Ribbon: In the Query pane, select a field, and then on the Field tab, in the Display group, click Traffic Lights.Shortcut Menu: Right-click a series on your chart, point to More, and then click Traffic Light Conditions.
The Traffic Light Condition dialog box opens. For more information, see Traffic Light Condition Dialog Box.
- From the Relational Operators drop-down menu below the field name, select a relational operator. For example, Greater than.
- In the field
to the right of the operator drop-down menu, click the arrow for
the Type drop-down menu.
The Type dialog box opens.
- In the Type
dialog box, select Field.
The Type dialog box displays the Dimensions, Measures, and Properties of your data. You can display the data in the following ways:
View fields in business order. Select from the following options: Title, Description, Name, or Alias.View fields in a sortable grid. Select from the following options: Name, Title, Alias, Format, Segment, Filename, Description, or Reference.View the hierarchical structure of the data. Select from the following options: Title, Description, Name, or Alias. - Select a field.
- Click OK.
The field that you selected appears in the field to the right of the operator drop-down menu.
- Click the Color button.
The Color dialog box opens.
- Select a
color.
The color appears in the Preview box.
- Click OK.
- Click the
Drill Down button.
The Drill Down dialog box opens.
- In the Drill
Down dialog box, specify a value for each of the following:
Drill down to a report or a webpageURL of the webpageAn alternate commentTarget (New Window, Same Window)Parameters that you want to use (Name, Value)
- Click OK to close the dialog box.
- Click the New button to set traffic light conditions for additional fields.
Change the Title of a Series
- Procedure
- Create a chart.
- Open the
Edit Title dialog box in one of the following ways:
Shortcut Menu: Right-click a series on the chart, and click Change Title.Query Pane: Right-click a series, and click Change Title.
The Edit Title dialog box opens.
- In the Enter Title field, type the new name for the series.
- Click OK to
close the dialog box.
The series has a new title.
Control the Color Mode
When you create a single-series chart, all series groups appear in the same color. To use a different color for each group, set the color mode to By Group.
- Procedure
- Create a chart.
- Right-click a series on the chart, point to Color Mode, and then click By Group.
- Click Run to generate the report.