Using Visualizations at Run-Time
In WebFOCUS InfoAssist, you can run visualizations that are either saved or run dynamically at run time. In this case, the visualization opens in a separate browser window, as shown in the following image.
In the WebFOCUS Business Intelligence Portal, all users can run stored visualizations that are available to them. In this case, the visualization opens in a new page.
Working With Filters at Run Time
If you have added a filter to your visualization, you can use the Prompts panel to control the display of information. When you run your visualization, the Prompts panel appears. This enables you to select additional components by which to filter the visualization.
Note: The filters that you apply at run time can be removed using the Remove Filter option in the Run-Time toolbar. This does not apply to filters that were added prior to running the visualization.
The following image shows an example of a visualization with an open Prompts panel.
Note: If you select (or lasso) components of your visualization, the Prompts panel does not automatically update to reflect your selections.
Filter Data With Tooltips at Run Time
- Procedure
- Run a visualization from one of the
following locations:
From the WebFOCUS .
From the Application Main Menu or Quick Access Toolbar in WebFOCUS InfoAssist.
- Click, point to, or lasso data in your visualization.
A tooltip opens, as shown in the following image.
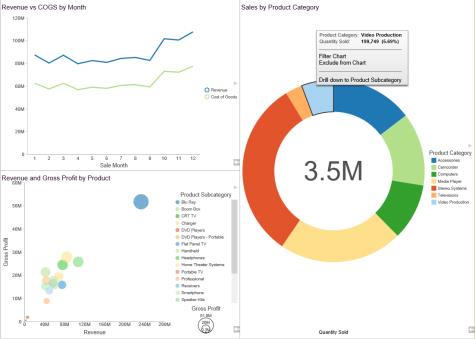
The tooltip includes the following options:
- Filter Chart. Filters the visualization by the data values that you have selected.
- Exclude from Chart. Excludes the selected data values from the visualization.
- Remove Filter. Removes the filter and returns the visualization to its original state.
Note:
- The same run-time options are available when you run your visualization on a mobile device.
- If you are working with a single bar, line, or other visualization object that displays a single point or value, the Filter Chart and Exclude from Chart options are not available. This applies when working in Live Preview and at run time.
Viewing Data at Run Time
When viewing data at run time, you can access the data behind each visual in your visualization. Using the Show Data option, which is available from the Run-Time toolbar, you can view your data in summary format. This grid display includes totals for the categories in your visual, based on the data fields that you selected. All WebFOCUS InfoAssist users can use this option with the visualizations that are available to them.
View Data at Run Time
- Procedure
- Run a visual or visualization from one
of the following locations:
From the Application Main Menu or Quick Access Toolbar in WebFOCUS InfoAssist.
From the WebFOCUS .
- In the bottom-right corner of the visual cell, click
the arrow.
The Run-Time toolbar opens.
- Click the Show Data button
 .
.
The visual changes to the grid view, displaying the underlying data for the selected visual.
Click the Show Data button again to return to your visual.
Note: The same run-time options are available when you run your visualization on a mobile device.
Using the Run-Time Toolbar Options
You can access the Run-Time toolbar by clicking the arrow button, which is located in the bottom-right corner of each visual cell at run time. The Run-Time toolbar is shown in the following image.
The Run-Time toolbar options are described in the following table:
|
Icon |
Name |
Description |
|---|---|---|
|
|
Show Data |
Alternates between the visual and the grid view, which shows the underlying data. To return to the visual view, click the Show Data button again. |
|
|
Reset to Default |
Resets all changes and returns the visualization to its original state. |
|
|
Remove Filter |
Removes the filter and returns the visualization to its original state. This option is only available if a filter is applied at run time. |
|
|
Show/Hide |
Shows or hides the options on the Run-Time toolbar. |


Note: The same run-time options are available when you run your visualization on a mobile device.