Using NLQ On Your Data
Natural Language Query, or NLQ, lets you ask questions of your data using everyday language. This provides you with valuable insights and allows you to make informed business decisions.
NLQ translates natural language into SQL code that can be run against a database. The natural language phrases are matched with a relevant database schema column within your data, and your query results are displayed as a table. A maximum of 50 columns can be processed.
Examples of natural language queries include:
- What are interest rates
- Show me income_category
- Give me sales by product name
- Show me patients by doctor
- Give me an average loan by application_type
- Show me offices by city and country
- What is the total loan for low income category
- What is my revenue in June 2021
The NLQ engine understands the concept of time and supports different date formats. It supports one date/time column. You can refer to a date or date range in your queries, for example: sum profit for March 2013, or sum profit for March 1 2013 to March 14 2014. The following exact date formats are supported: YYYY-MM-DD; YYYY/MM/DD; MM/DD/YYYY; MM-DD-YYYY.
Access NLQ from the ibi WebFOCUS Hub
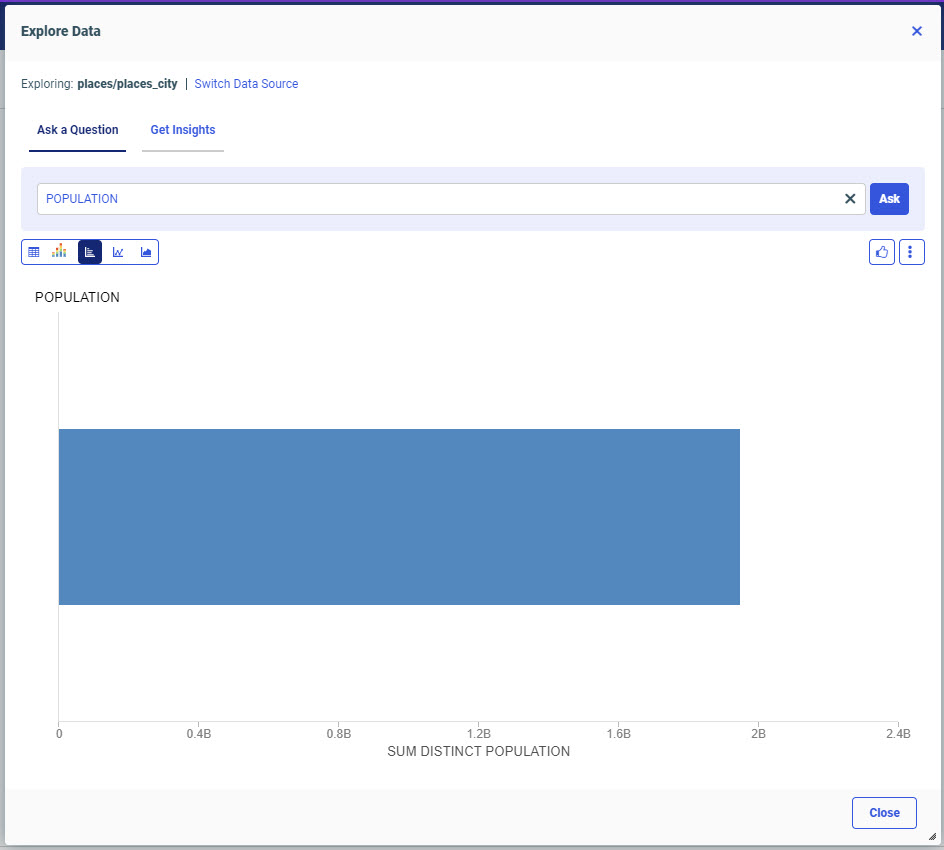
You can access NLQ from the WebFOCUS Hub and make natural language queries against your data to gain insights. The following image shows the Explore Data window.
- Procedure
- From the WebFOCUS Hub, click the plus menu.
- Click Explore Data.
The Select Data Source dialog opens.
- Navigate to your data source.
- Click Select.
The Explore Data dialog opens.
The column names of your selected data source are displayed. You can choose a different data source by clicking Switch Data Source.
- Type a question about your data in the search field.
- Click Ask.
You can run your query results in a new window by clicking the output options button and selecting Run in new window.
Note: If your query does not result in matching data, the NLQ engine will suggest rephrasing your query, and offer examples to model your queries after. - You can change the visualization of the searched query from the options available on the Explore Data window.
For more information, see Changing the Visualization of Query. - Click Close to close the dialog and return to the Hub.
Save Your NLQ Results
When you use NLQ on your data, your results display as a table. You can easily save your results for future use.
- Procedure
- Click the output options button
 .
.
- Select the Save to workspace option.
The Save dialog opens, as shown in the following image.
You can title your visualization and save it to a location you choose.
- Click Save.
Changing the Visualization of Query
Based on the query, the system defines the recommended visualization for the result and the result is generated in that visualized format. Currently we support Bar Chart and Line Chart Visualization formats. The recommendations are based on the following rules.
| Format | Variables in the Dataset | Number of Records |
| Bar chart | An ordered data variable that can be identified as a dimension | Less than 21 |
| Line chart | An ordered data variable that can be identified as a dimension A temporal data variable |
Less than 50 |
Additionally, the visualized output can be changed to other formats like area chart or grid(table) view. This can be done from the chart switcher 
Access NLQ from Application Directories
-
Select Application Directories from the Hub.
-
Navigate to the file which you want to generate insight.
-
Right-click the data and select Get Insights.
-
Select Ask a Question to provide search queries.
-
Use the Fact tables to switch between insights.
-
Select Close to exit from the Explore Data window.
-
Select Tools icon then select View Insights Generation Status to view the status of all insights.