Introducing What-If Assist

In this section:

As of Release 8.2 Version 04, a trial version of What-If Assist is automatically installed with WebFOCUS. It is enabled, by default. This trial version allows you to become familiar with the What-If Assist product and help you determine if this chart extension meets the needs of your organization. The trial version is free and is marked with a watermark, by default.

You can access the trial version of What-If Assist from the Other Chart Types option on the Format tab in InfoAssist. From the left pane, click HTML5 Extension. Scroll down to the What-If Trial version and click OK.

Using the What-If Assist Trial Version

What-If Assist is a multi-faceted modeling application that you can use to brainstorm sample hypothetical scenarios with your data. In WebFOCUS, What-If Assist is a new chart extension that you can access and use from within InfoAssist. It enables you to brainstorm sample hypothetical scenarios with your data.

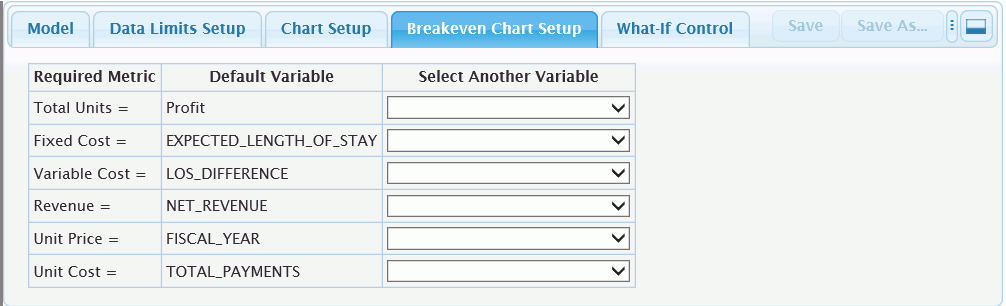
You can perform Investment Analysis, enabling you to achieve goal-based measures such as Break Even Income, Break Even Units, Return on Investment (ROI), and Return of Capital.

A feature of What-If Assist is the Attainable Financial Goal that is achieved by confining root values to their practical limit of accomplishment. This is often termed as the "response to anticipated circumstance."

You can also perform Operating Analysis, with the ability to compare current and past performance Reporting Financials. As an outstanding modeling application, these offerings can go to work for you.

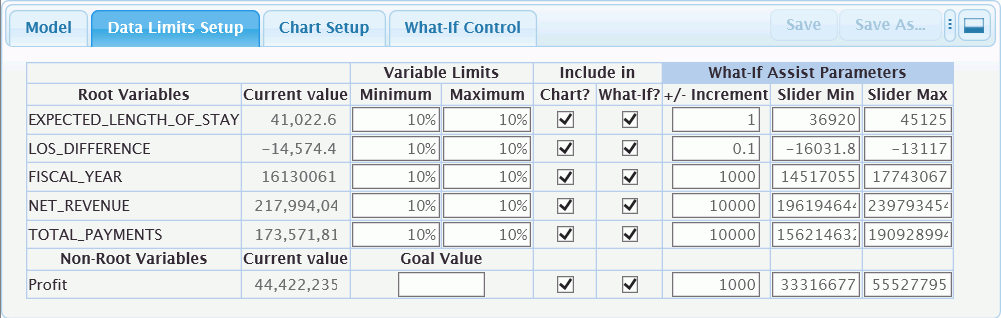
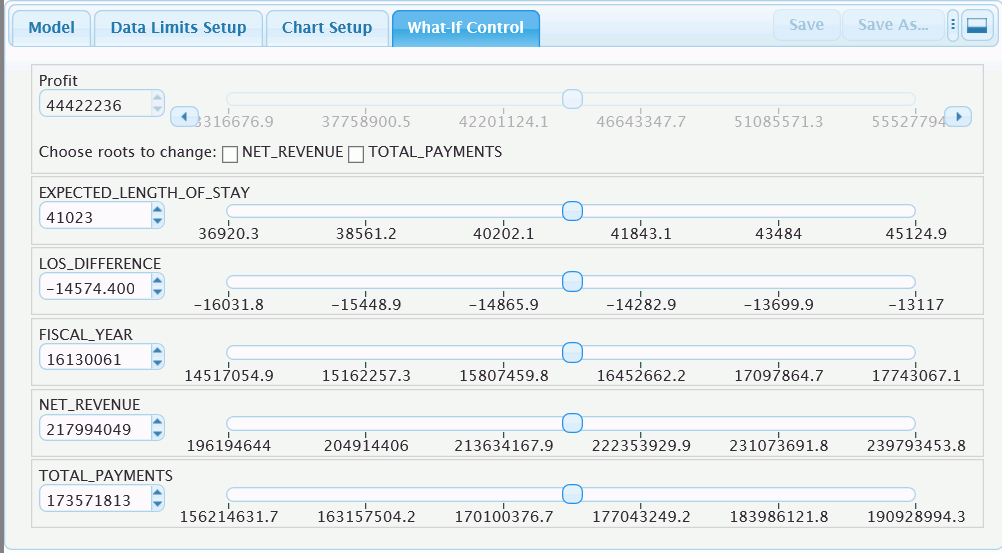
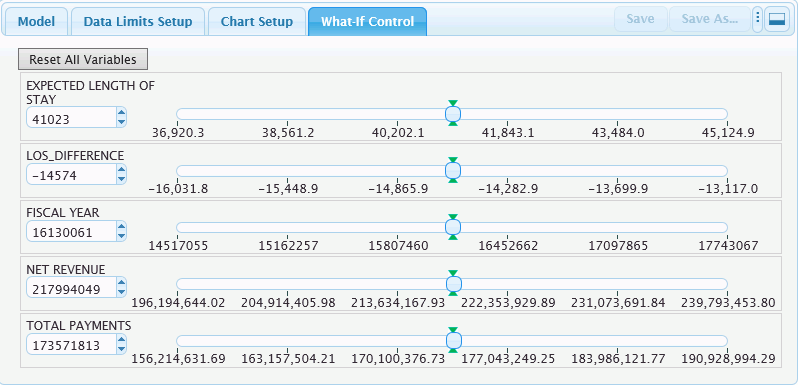
For both Investment Analysis and Operating Analysis, you can use the Data Limits Setup to define the minimum and maximum for each root variable. Limits can be expressed as a fixed value, or as a percentage below and above the current value.

You can use What-If Assist to determine the management decisions that are required at every relevant level in order to reach an Attainable Financial Goal.

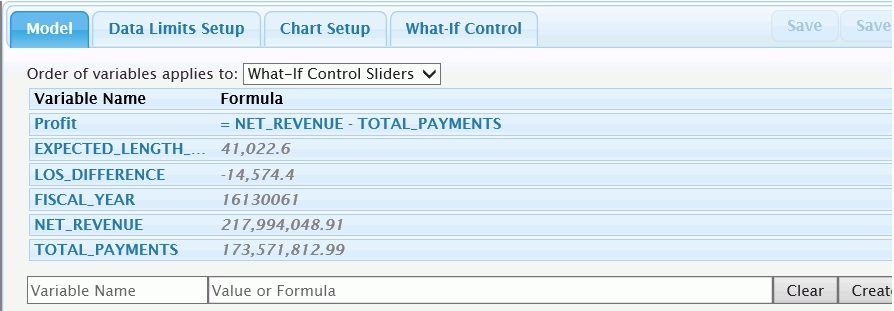
With What-If Assist, you can change variables, set upper and lower limits (goals), calculate and project results, and try out different scenarios. You can also save scenarios for later use and sharing with other members of your organization.

For example, if you are a finance manager or executive, you might want to see the outcome of your operating statements, and perform various budgeting and forecasting tasks.

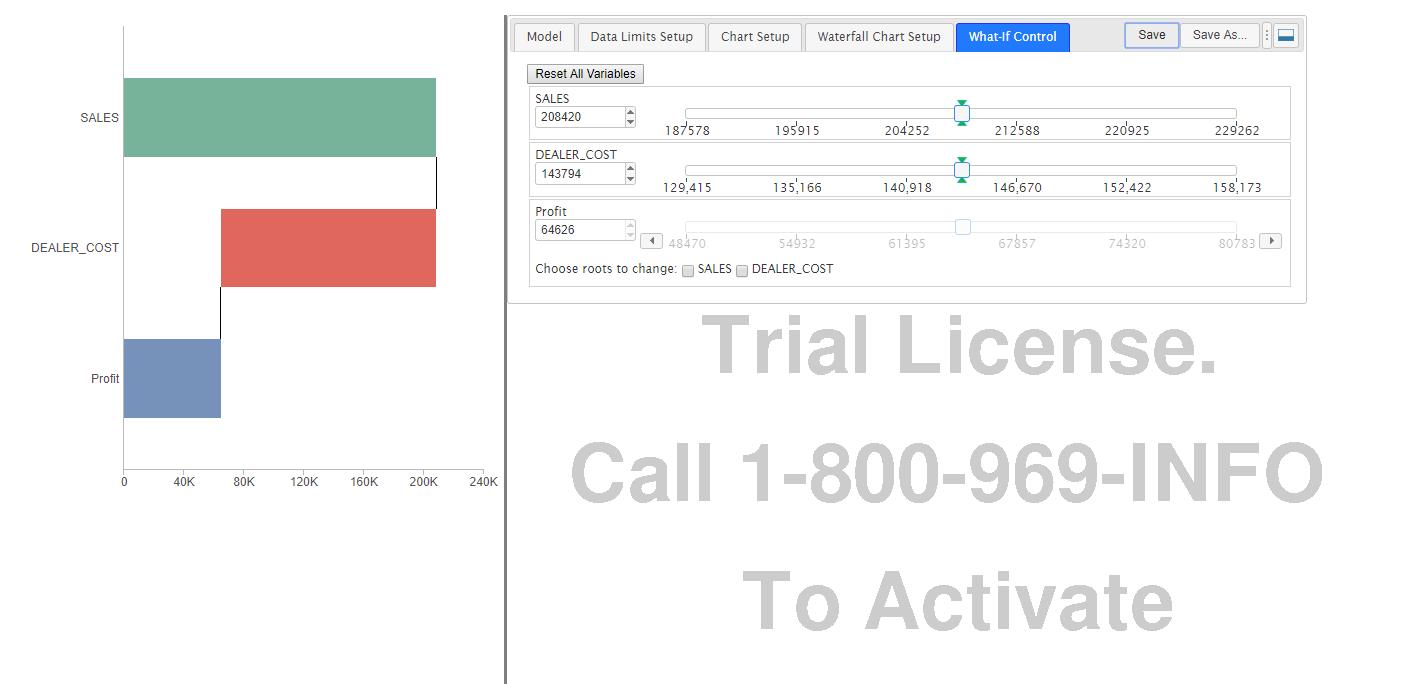
Use of What-If Assist assumes that you have purchased What-If Assist, which is available as a trial as of Release 8.2 Version 04, as shown in the following image.

Navigating What-If Assist

In this section:

You use What-If Assist to create a model. This process has three primary steps:
  1. Set up your environment.

    Ensure that What-If Assist has been installed by your administrator. Then, open InfoAssist, obtain your data, and locate the What-If chart extension in the chart extensions library (Other Chart Types). Next, run the What-If Assist chart extension. Once running, you can add variables or Defines, the latter of which requires you to include the root values that comprise any Define that you create. For example, if you create a Define that includes Net Revenue and Net Sales (Profit), you must add the Define, as well as the fields (Net Revenue and Net Sales) that comprise it.

  2. Run the extension.

    It is in this stage that you build the model and perform other tasks, such as adding variables, as needed. You can also change the type of chart or add a reference line.

  3. Establish limits for the model.

    You can use the What-If Control tab to change the roots and the Chart Setup tab to change the model.

The What-If interface has four primary tabs, as shown in the following image.

The tabs are as follows:
  • Model
  • Data Limits Setup
  • Chart Setup
  • What-If Control

Note: Additional tabs display when you visualize a different model on the Chart Setup tab.

Model Tab

When you access the Model tab, you can use the options to compensate for omissions or inadequacies in the information that is stored in WebFOCUS or your underlying CSV file.

The fields on the tab include:

Order of variables applies to. Controls the order model variables in the What-If control or chart risers. You can drag and drop variable rows in the table to any order. This applies to the What-If Control Sliders if a Breakdown chart is selected in the Chart Setup tab.

You can create a new variable by typing the name in the Variable Name field and a value or formula in the Value or Formula field. Click Create Variable to create and use the variable.

If a model contains one or more formulas where the roots are mutually cancelling (for example, C=A-B), the Negative effect option lets you select which root to apply a negative change in order to change the value of the non-root in the What-If Control tab. For example, consider that Profit=Sales-Costs. If we are trying to improve Profit both by boosting Sales and cutting Costs, Costs should be a negative effect root. However, if the only way we can increase Sales is to increase Costs, perhaps by improving the quality of the product, both would be expected to rise. In this case, we would not want Costs to be a negative effect root.

If the model contains formula errors, the formula will display in red on the Model tab. A tooltip identifies the error. You can use the Edit button to correct the formula or add any root variables (those that are part of the formula) that may be missing.

Edit. Changes the value of a root or the formula for a non-root.

Variable Name/Value or Formula. When you click an Edit button, the selected variable will appear in these fields. You can also add new variables to the model in these fields.

Clear. Discards any changes or additions.

Apply Variable. Applies changes or additions to the model.

Note: Any inaccuracy in a format displays in red text. You can use the Edit button to correct the formula or add any root variables (those that are a part of the formula) that may be missing.

Data Limits Setup Tab

On the Data Limits Setup Tab, shown in the following image, you can set variable limits and set options for including or excluding a root variable. You can also set an overall goal for your model.

Enter the minimum and maximum values that can be assigned to each root variable. Minimum and maximum can be entered as a specific value or as a percentage, as shown as the variable limit for all of the root variables in the image above. The minimum value must be equal to or less than the current value. The maximum value must be equal to or greater than the current value and greater than the minimum. If percentages are used, the minimum will be set for n% less than the current value and the maximum will be set to n% greater than the current value.

Include in Chart? Use the check boxes to include or exclude each variable in a chart. These check boxes are not applicable and will not appear for a Breakeven chart.

Include in What-If? Use the check boxes to include or exclude each variable from the What-If Control tab.

+/- Increment. The values in these fields define the increment in which the value of a variable can be changed in the What-If Control tab. It cannot be zero, and is typically about 1% of the range of the slider (Maximum - Minimum).

Slider Min/Max. These fields control the range of values shown in the slider panel in the What-If Control tab. For root variables, the default values are the values specified in the Maximum or Minimum fields. If these values are less than the limit of the variable, left and right arrows will be shown in the What-If Control slider panel. You can extend the range of the slider.

Chart Setup Tab

On the Chart Setup tab, shown in the following image, you can change the way your model is visualized. For example, you might want to see your data as a Waterfall chart instead of a bar chart. You can also use this tab to set a reference line or a titles and sub-title to your chart.

Visualize this Model. Opens a drop-down list menu where you can select a chart type. Note that the chart type must be compatible with the data set that was created in the Model tab or imported from a CSV file. Select None if you do not want or need to see the result of What-If exercises in a chart.

Chart Size. Controls the size of the space allotted for a chart.

Chart Title. Shows or hides and defines a chart title.

Chart Subtitle. Shows or hides and defines a chart subtitle.

What-If Control Tab

The What-If Control tab, shown in the following image, is used to adjust values in your model. As you slide the values from left to right and back, your chart reflects the modified values accordingly.

You can change the value of a variable by:
  1. Entering a new value in the text box.
  2. Clicking the spinner control next to the text box.
  3. Clicking and dragging the slider control button.
  4. Clicking on a value or tick underneath the slider control.
  5. Clicking the Goal value icon.

For non-root variables, you must select a check box next to Choose roots to change to allow one or more root variables to change for a bottom up calculation. Root variables shown in red identify negative effect (one root cancels another) conditions. For more information, refer to the information on Negative Effect in Model Tab.

If the number of roots exceeds the list in display, click the more.... button to access the full list.

In the NetRevenue slider panel, an inverted triangle options displays, showing the Goal Value that was set in the Data Limits Setup. You can click on the goal marker and set the variable's value to the goal.

When Slider Min/Max values are set to less than the variable's min/max, you can use the left/right arrow buttons under the slider to expand the values of the slider control. Left/right horizontal buttons will not display if Slider Min/Max=Variable Min/Max.

There are two additional tabs that display when you select different chart types. These are: Breakeven Chart Setup and Waterfall Chart Setup. These only display when you have changed the chart type on the Chart Setup tab.

Breakeven Chart Setup

You use the fields on the Breakeven Chart Setup tab, shown in the following image, to assign user-specific variables to metrics that are required to perform Breakeven/Investment Analysis.

Waterfall Chart Setup

On this tab, you can select variables to show as Total or Subtotal risers (typically the first and last columns in an Operating Statement), as shown in the following image.

Creating a Simple What-If Assist Model

How to:

What-If models use measure data in their analysis. Therefore, you can select one or more measure data fields to add to your model.

Note: You can create and add Defines to your model, however if you include the Define in the Measure field container, you must also include the measure fields that comprise the Define.

Procedure: How to Create a Simple What-If Assist Model

  1. Sign in to WebFOCUS.
  2. Open InfoAssist in Chart mode and select a data source.

    Your data loads.

    Note: You can also click Upload Data to import a .csv or Excel file. Variables from the selected masterfile or uploaded data are shown in the Data pane under Measures/Properties.

  3. On the Format tab, in the Chart Types group, click Other.
  4. In the HTML5 Extension grouping, select the What-If chart extension and click OK.
  5. From the Data pane, add one or more measures into the Measure field container in the Query pane.
  6. Optionally, create Defines and add them to the measure field container. You can use the Detail (Define) button on the ribbon to define non-root/calculated variables.

    Note: Non-root/calculated variables are essential to What-If Analysis. For example, what would Revenue be if DEALER_COST increase and RETAIL_COST decreased. You can also define non-root variables and formulas using the What-If Assist Model tab.

    For more information on creating Defines, see Creating Virtual Fields in WebFOCUS.

  7. Save the FEX (procedure).
  8. Run the FEX in a new window.
  9. Finalize the model by choosing the chart type and setting data limits.
  10. Save the finished model which shows up as a .WIF file in WebFOCUS.

    Note: You will encounter Runtime View, which is a mode of running the final .WIF mode that shows only the Chart and What-If tab when the user running the model has only basic-user permissions. If you have developer privileges for the .WIF, you can open the .WIF by running it and making additional changes to the model formulas, data limits, and graph properties.

Resetting Variables in What-If Assist

What-If Assist allows you to model different scenarios, giving you the opportunity to review how a change in a variable impacts your scenario. For example, if you are working on the What-If Control tab, you can manually shift the value of your variables using the slider. This sets a new value for the variable. In some cases, you may have one or more slider changes to any set of variables.

Note: If you want to reset an individual variable, click the green base value triangles along the relevant slider path to return it to its original value.

Since you may be modeling different scenarios, you can reset the variables to their original value by clicking Reset All Variables, as shown in the following image.

This resets any variable that was shifted or changed, back to its original value. This also preserves any modeling-variables that are used in other tabs. You can reset all variables at any time, even it is just one variable that changed. This gives you more flexibility in modeling while working with shifting variables.

Predicting With What-If Assist

Using different chart types to model your underlying data, you can make predictions and foresee potential issues regarding your organization. You can create any number of Defines and variables and use these to expand your analysis.

You can save your What-If models and use these to create a history of an issue. This allows you to identify trends in your data.

What-If offers predictive analytics, giving you an edge in understanding your data by bringing it to life.


WebFOCUS