|
How to: |
Changing the display or output format of measure fields that have been placed on the canvas or in field containers allows you to control how values in a field are interpreted and the styling that they use when displayed. This feature allows for field display formatting, which is essential for any data-based content design tool.
Note: These formatting options are applied when the WebFOCUS Reporting Server retrieves data from the data source. When that data is passed to the JavaScript chart engine to generate the chart, some formatting information may not be included and replaced with default settings. All formatting is still applied in a spreadsheet of your data created using the Export data option on the Application menu.
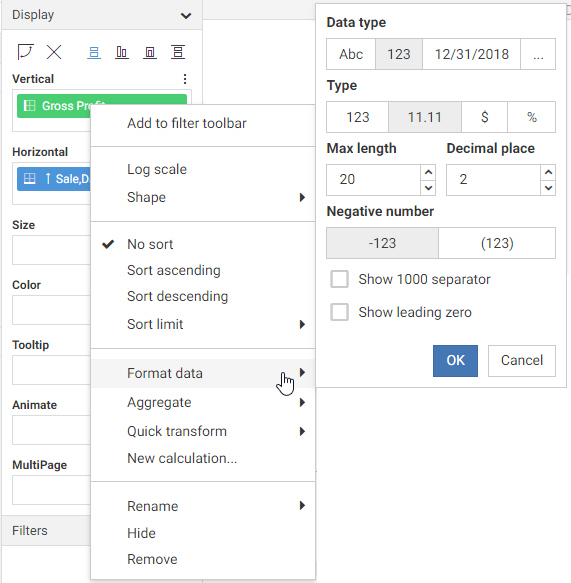
To change the format of a field in a bucket in the Display pane, right-click the field and point to Format data, as shown in the following image.
Note: When editing the format of a field, the only options available are those that are relevant to the selected field.
When creating or editing a calculated field, you can access Data Format options by clicking the Edit Format button, which
appears with a different icon depending on whether the field is a number  , character
  , or date field
  , and which is located above the Operator Selection pane next to the field name, as shown in the following image.
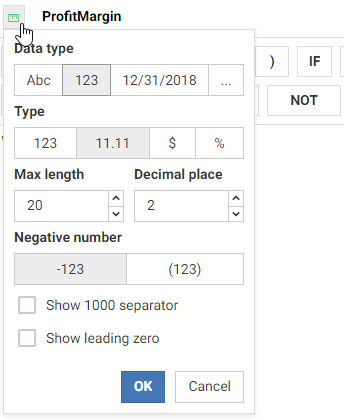
To edit the format of a field, first select the data type, then set details specific to that data type. In the following image, the numeric data type is selected, providing options for numeric fields.
- Character format, for fields containing letters and numbers.
- Number format, for fields containing numbers that you want to sum or aggregate.
- Date format, for fields containing dates.
- Other format, for fields that have values that do not match one of the other formats, such as date-time fields or string fields, or are a variety of another type of field, such as packed decimal fields or Julian date fields.
When you select the character data type, you can specify character-specific formatting, as shown in the following image.
You can use the Length option to select the number of characters to display in the field, and enable variable length. Variable length indicates that the number of characters can vary depending on the data that is stored in the field.
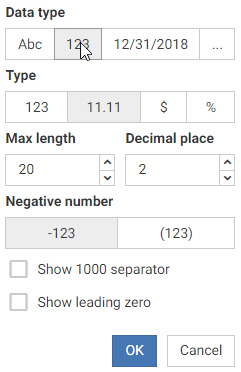
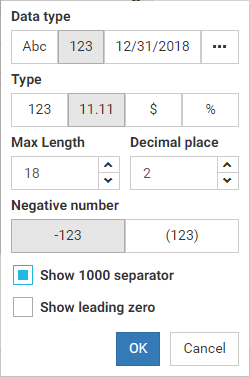
When you select the numeric data type, you can specify number-specific formatting, as shown in the following image.
You can choose whether or not to display decimals, and set the maximum number of digits to show before and after the decimal point. You can also choose how to format negative numbers, whether to show thousands separators, and whether to show a zero before the decimal point when the value is less than one.
You can also specify currency and percent variations, such as a different currency symbol or a change in the use of a percentage value. When you select the currency option under Type, the Currency symbol and Symbol position options appear, allowing you to select the currency symbol and how it displays.
When your data type is a date field, you can make a selection from the supported date formats that are available for selection. The options for a date field are shown in the following image.

The Date format menu shows a list of date formats as applied to December 31 of the current year. You can select date formats that use separators or month names, or show a single date component.
When you select a date format that uses a separator, the Date separator menu is available. You can choose to use a slash (/), dash (-), dot (.), or space.
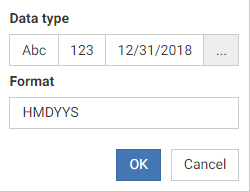
If you want to use a format not available in the character, number, or date sections, you can select the Other data type. Type a valid WebFOCUS field format into the Format text box. For example, the following image shows a field using the format HMDYYS, which is a date-time format.