In this section: |
How to: |
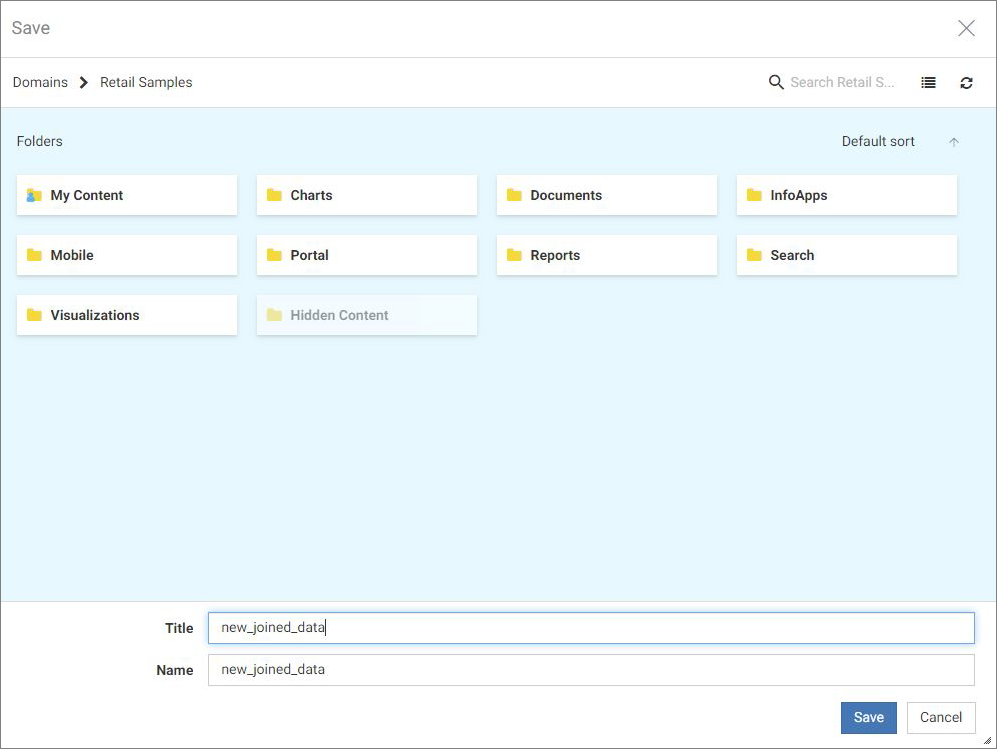
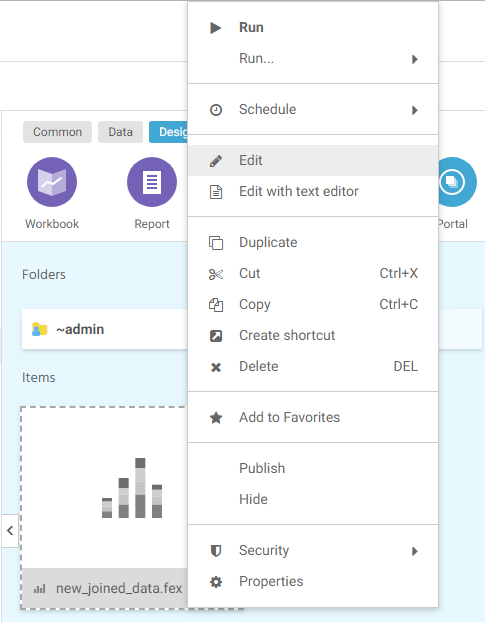
In WebFOCUS Designer, you can Join data when creating a Chart or Workbook, and create new content from your joined data.
The joined data structure is used when WebFOCUS runs the Chart or Workbook, and is not applied permanently to the metadata. This allows you to virtually join multiple data sources as if they were a single data source, from which you can report in a single request. This can increase the number of relevant fields available for use in your content, giving you an expanded selection of data specific to your charting purposes.
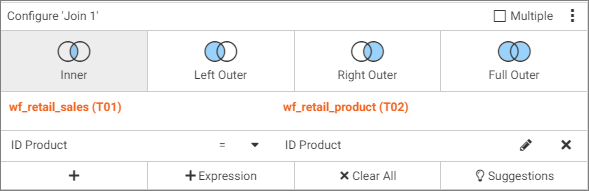
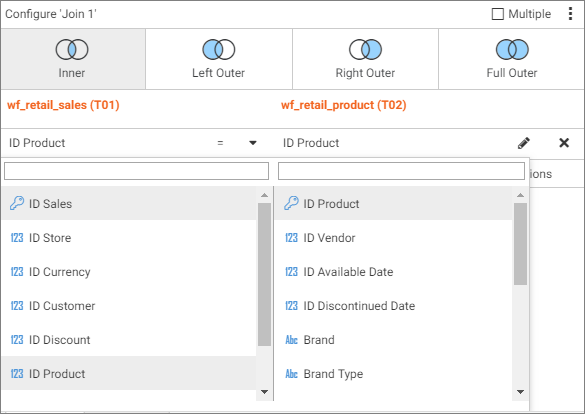
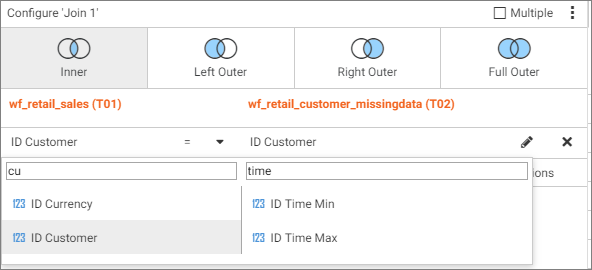
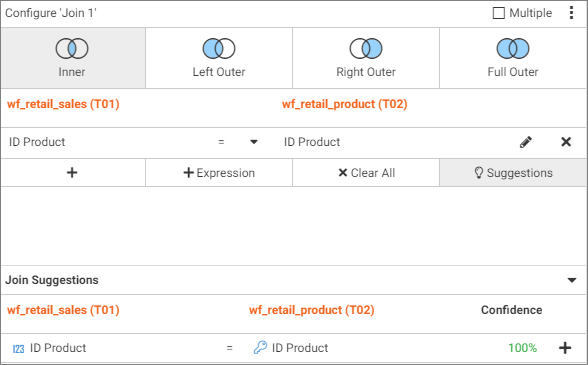
The join is created when fields that match in your original data source and second data source are identified. For example, you can join two data sources on a join field of ID Product, using just one data source in your chart. You can then create content using your joined data source.
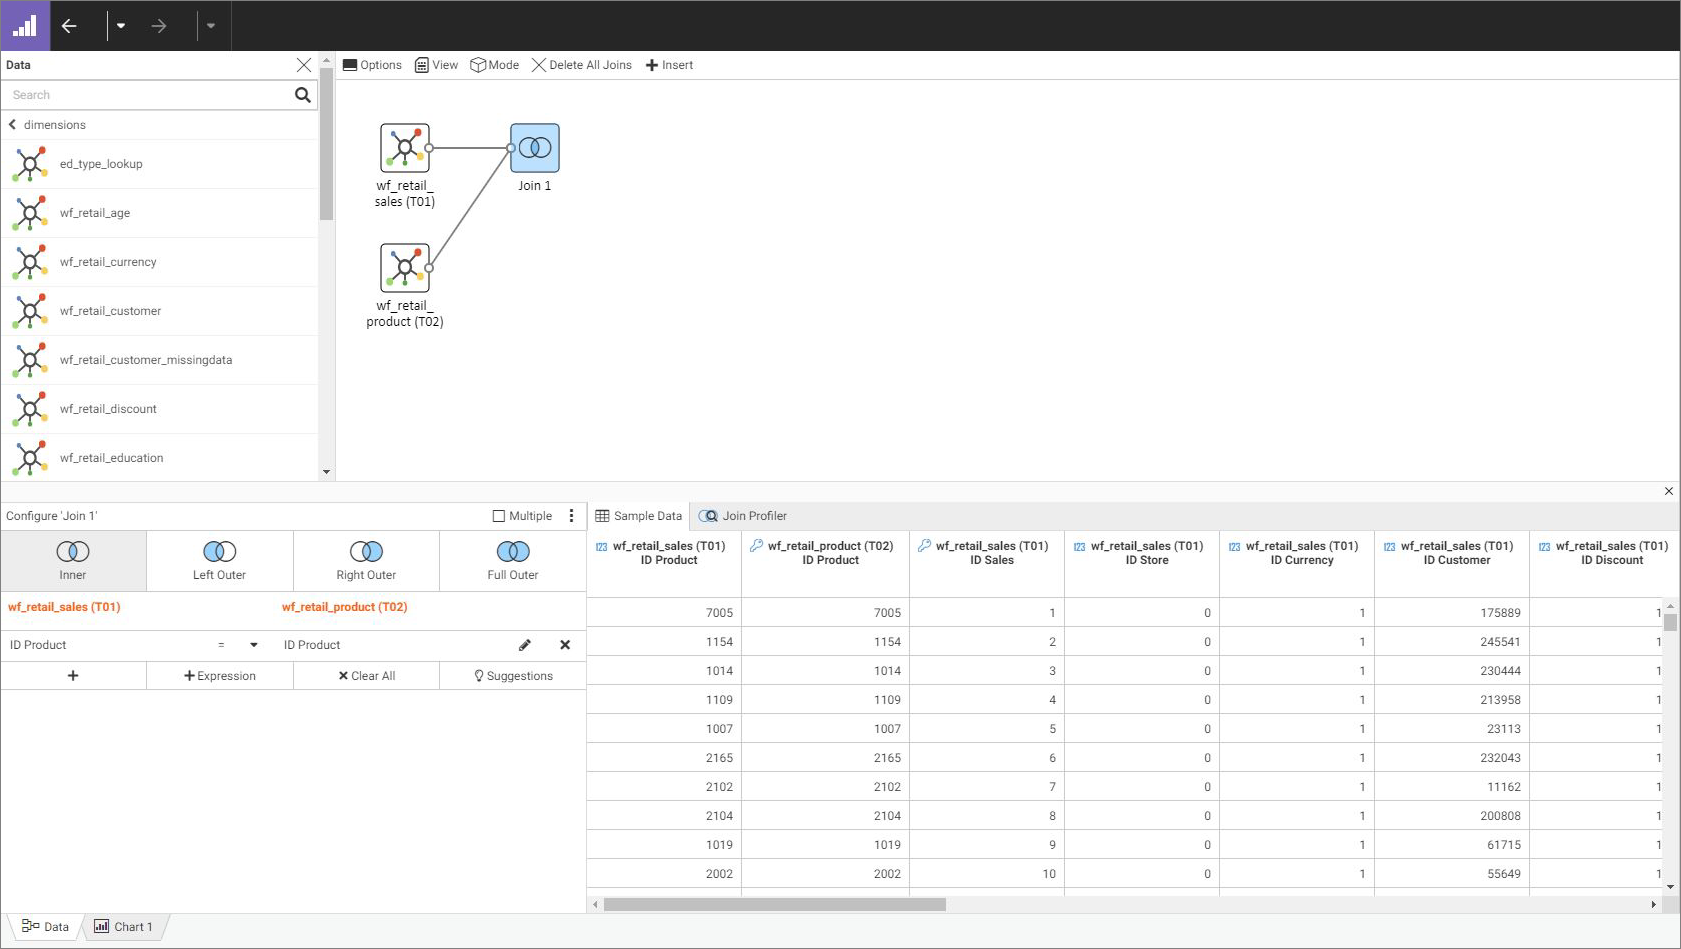
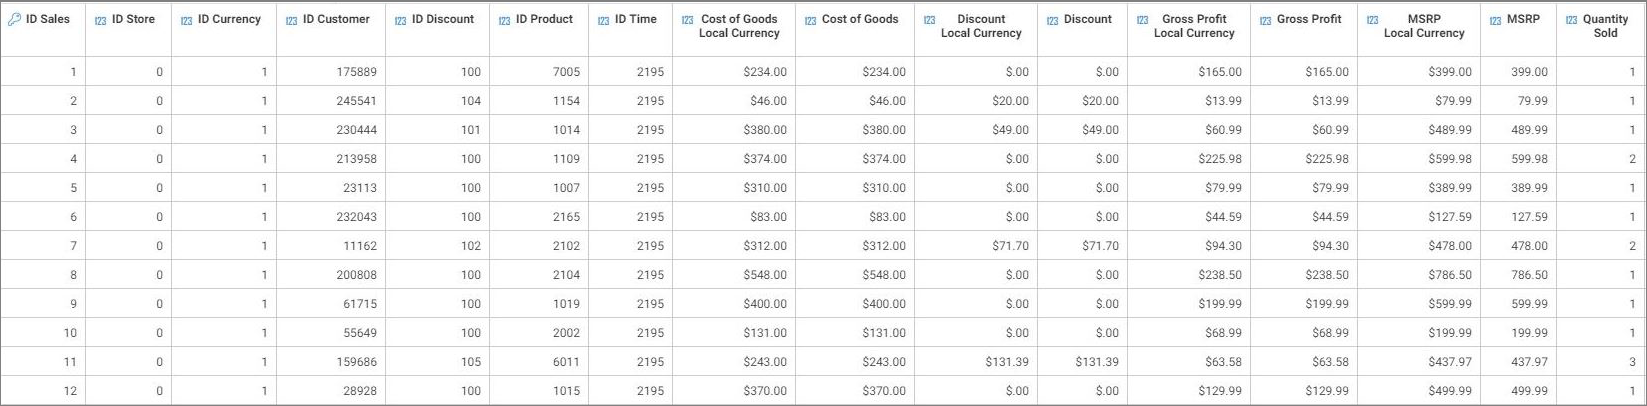
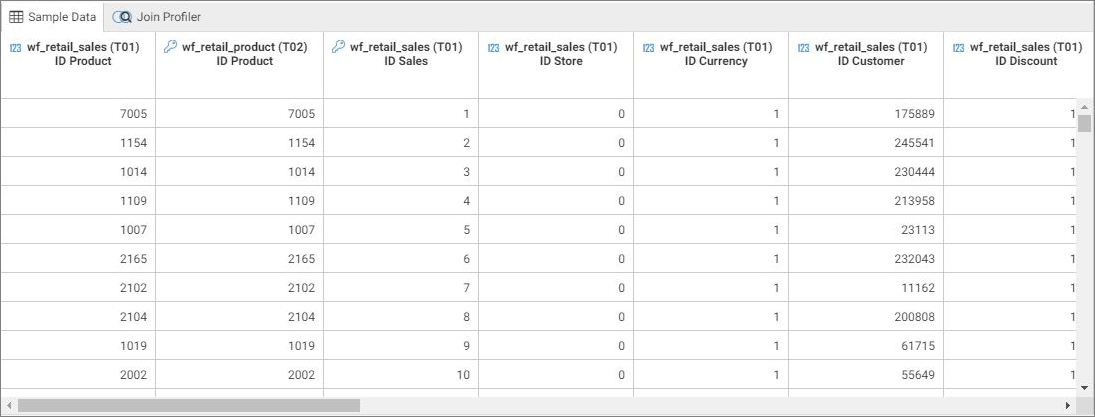
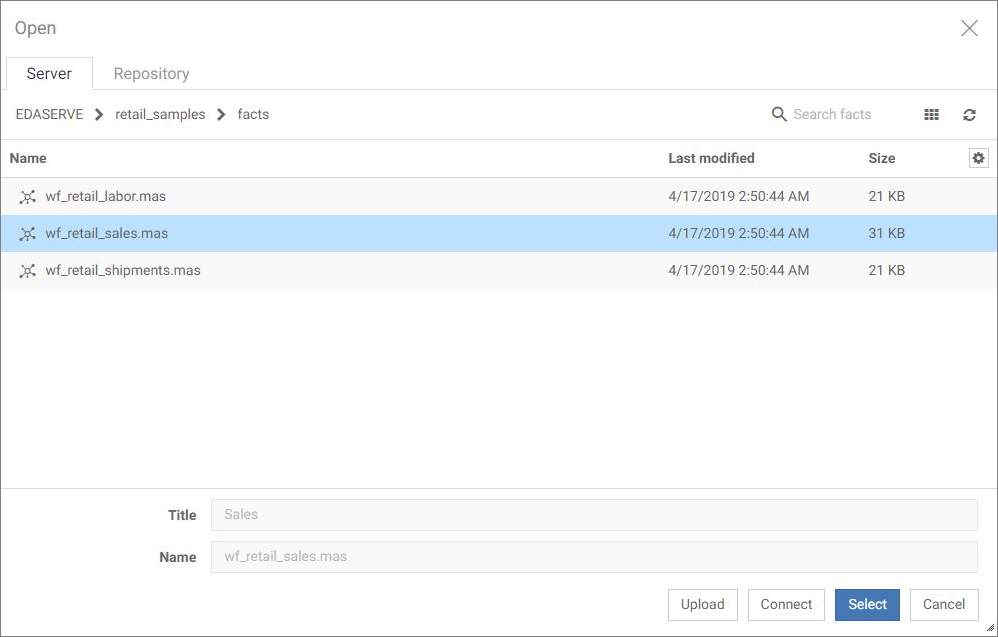
The following image shows the Data tab within WebFOCUS Designer displaying an original data source.
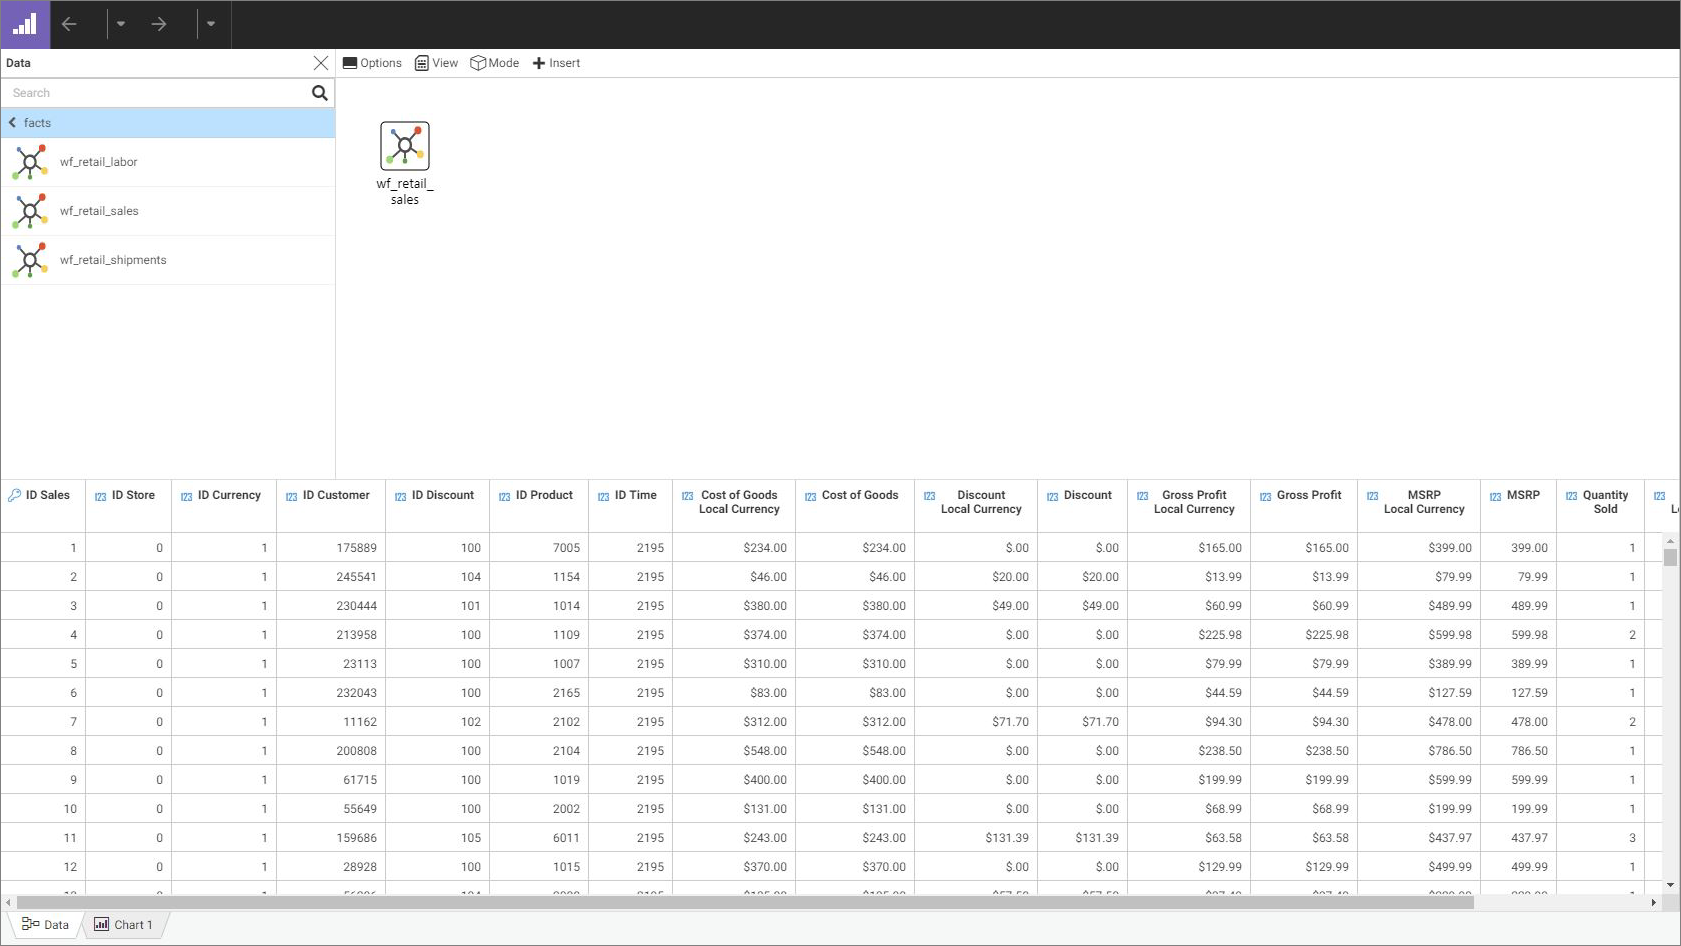
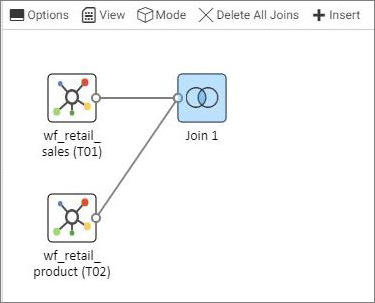
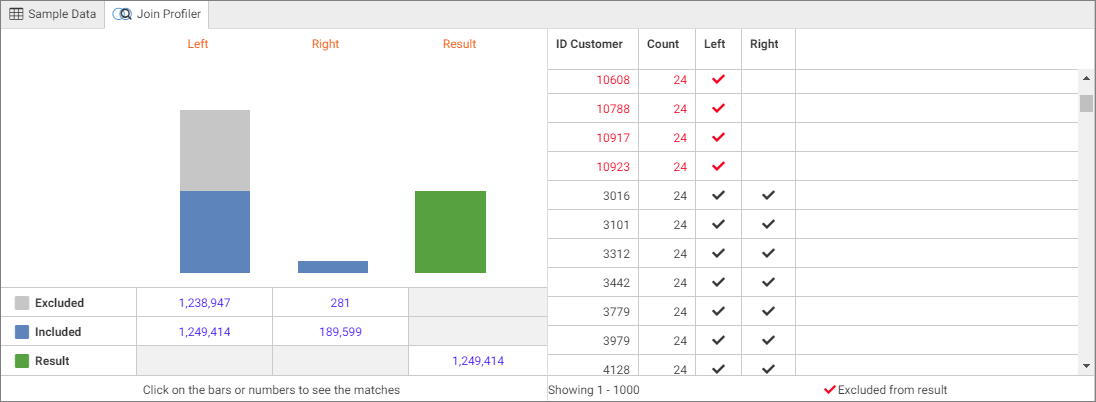
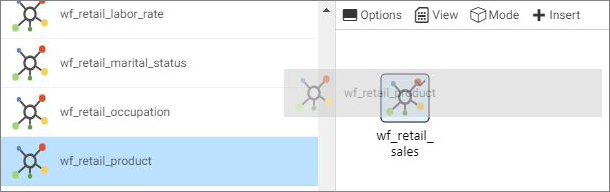
The following image shows the Data tab within WebFOCUS Designer displaying joined data sources.
Use the Resources tree to select synonyms from your application path that you want to add. Click an application folder to display the available synonyms in that folder. You can return to the previous folder by clicking the folder name at the top of the tree, as shown in the following image.
You can drag a synonym from the resources tree onto the canvas, on top of your original data source, to join them together. A join object is added between the two synonyms on the canvas, as shown in the following image.
You can also drag additional synonyms into the canvas. Right-click the join object or a synonym joined to the original data source, and click Delete to remove the join from the data flow.
You can make the following edits from the canvas toolbar:
Options
View
Mode
Delete All Joins
Deletes all joined segments.
Insert
You can insert a child or root in Model mode. You can add a join in Flow mode.
The current state of your data is reflected in the Data sheet, which shows a data sample in a tabular format similar to a spreadsheet, as shown in the following image.
If you click the Sample Data tab, which is the default setting, the values for the field being joined in each synonym are displayed, as shown in the following image.
If you click the Join Profiler tab, a join analyzer chart displays the number of matching values from each part of the join and the total number of values included in the data source as a result of the join, and a key fields grid showing LHS and RHS match states, as shown in the following image.
You can click the table bars or numbers to display the matching fields in the report. Clicking the filter icon clears the matches and returns the report to show all values, as shown in the following image.
You can modify the join using the Join configurator, as shown in the following image.
You can display the joined fields using the double drop-down menus, as shown in the following image.
Type inside the search bars to restrict the field results displayed in the drop-down menus, as shown in the following image.
Click Suggestions to display Join Suggestions, including a confidence score based on any database relationships and the number of matching names in the fields, as shown in the following image.
Click the plus icon to add the suggestion to the join pair list.
You can join data sources based on shared fields to enhance the data available to you, and then create charts based on the joined data source.
Note: The Report button appears in the Designer tab if you have enabled the Technical Preview feature.
The selected data source displays on the canvas and in the tabular Data Sheet, as shown in the following image.
A join object is added between the two synonyms on the canvas, and panels display for configuring and profiling data, as shown in the following image.
The Save dialog box opens.
Your new joined data is saved. From the chart tab, you can create content from your new joined data.
Note: You can edit your joined data and perform other property-related tasks using the shortcut menu from the WebFOCUS Home Page, as shown in the following image.
|
WebFOCUS |