Performing Basic Calculations
|
How to: |
You can use the Calculator to perform basic calculations on fields in your data hierarchy. When you create a calculated field, a new, unique field is created. It incorporates all of the data fields and expressions that you added to the calculation.
Once the calculation is complete, a new data field is created which can subsequently be used in your chart. This field is placed on the Data pane, using the label of the originating field on which you created the initial calculation. For example, you can perform an addition operation on two fields. This action sums the values of the fields, displaying the total of the two when the field is used in a chart. You can also perform more advanced calculations that can result in different outcomes.
Calculated fields include DEFINEs, COMPUTEs, Aggregations, and other calculated fields. You also have access to WebFOCUS
functions that can be used in a calculation to perform specific operations on character and numeric fields. These display
in a list of available functions ![]() . They are separated into categories, listed in alphabetical order, and are case-insensitive.
. They are separated into categories, listed in alphabetical order, and are case-insensitive.
A DEFINE field is evaluated before data aggregation, while a COMPUTE field is evaluated after data aggregation. This means that DEFINE fields are especially useful to sort the data in a chart or report, while a COMPUTE field is especially useful as a measure field.
You can determine whether a calculation will be created as a DEFINE or COMPUTE by noting whether or not the Calculate after aggregation check box is selected. When selected, a COMPUTE is created. When cleared a DEFINE is created.
Access the Calculation feature in one of the following ways:
- Right-click a field in the Field panel and click New calculation. This creates a DEFINE with the selected field added automatically to the calculation. The calculated field is added to the Data pane.
- Right-click a measure field in a bucket and click New calculation. This creates a COMPUTE with the selected field automatically added to the calculation. The calculated field is added to the bucket from which you accessed the calculator.
- Click the menu in the Dimensions area or Measures area of the Data pane, and click New calculation. This creates a DEFINE. The calculated field is added to the Data pane.
- When creating a report, click the menu for the Rows bucket or the Summary, Count, Detail, or Detail with counter bucket, and click New calculation. This creates a COMPUTE. The calculated field is added to the bucket from which you accessed the calculator.
- Right-click a calculated field that you created previously and click Edit calculation. This allows you to modify an existing calculated field. This option is available from the Field panel for DEFINE fields, and from a bucket for COMPUTE fields.
Using the calculator, you can create basic calculations, as shown in the following image.
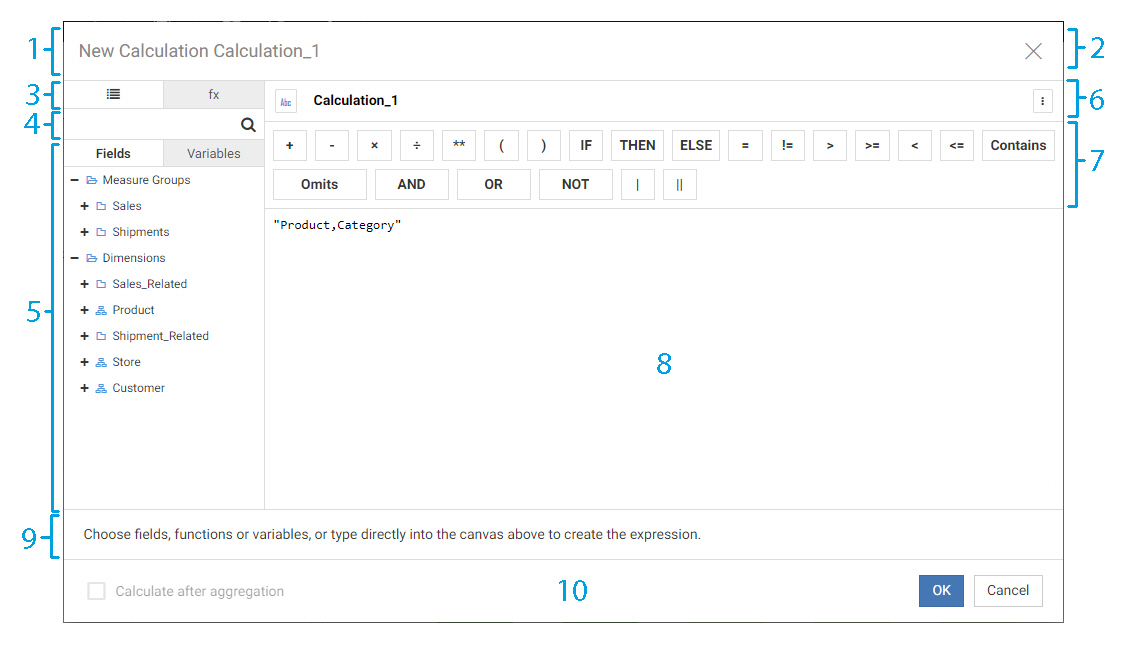
- Title bar. Shows context information about the current calculation. For example, New Calculation or Edit Calculation, along with the field name.
- Close button. Closes the Calculator. Clicking this button performs the same function as the Cancel button.
- List chooser. Allows you to select which list should be displayed in the Calculator. For example, functions.
- Search box. Allows you to search for components across all subjects (Fields, Functions, and Variables). The search will find matches
on contiguous text and performs a case-insensitive search. A flat list of matches is returned.
- For Fields, matches are performed on Name, Title, and Positional (folder or segment) information in the hierarchy.
- For Functions, matches are performed on Name, Category, Parameters, and Help text.
- For Variables, matches are performed on Name.
- Field/Function/Variable list. Lists the fields, functions, or variables that are available for selection and on which you can perform a calculation.
The following considerations apply to Field/Function/Variable lists.
- A Field list will always present with Single-list mode. It operates the same way as the Field List tab in the Field Tree.
- The Function list displays a categorized list of WebFOCUS functions, sorted case-insensitive in alpha order (ascending or
descending). You can use the drop-down menu to select the category of the function that you want to use, or you can search
for a function. Double-click or drag and drop a function into the Canvas and then supply parameter values to use it.
You can still use a function, even if it is not listed, by typing it into the calculator canvas. See the Using Functions technical content for a complete list of available functions, including legacy functions.
- A Variable list displays a list of system variables in WebFOCUS. The Variable list tab operates the same way as the Variable list tab in the Field Tree.
- Calculated field definition area. Displays the field name for which an expression is being created. It displays an icon (separate) to allow its format to be
set with the Data Format Selector.
- Format icon. You can use the Format icon to change the target field format for the calculation.
- Properties icon. Enables you to change the target field properties for the calculation.
- Operator Selection pane. This pane displays a full, contextualized list of operators that are available in calculations. It also displays mathematical and logical operators. Additional statements (IF, THEN, ELSE) are also included.
- Canvas/typing surface. This is where you build your calculation. It shows fields, aggregations, and other items related to the calculation you are creating. It also supports functions, variables, operators, values, and placeholders.
- Function Help. When working with Functions, you may receive help messages, such as a description of the selected function and the values that you must supply.
- Actions. The Actions area of the Canvas contains a Calculate after aggregation check box to indicate whether the calculation is a DEFINE evaluated before aggregation or a COMPUTE to be evaluated after aggregation. You can close, cancel, or commit the calculation to be performed.
Procedure: How to Create a DEFINE Field Using a WebFOCUS Function
A DEFINE is a virtual field that is evaluated as each record that meets the selection criteria is retrieved from the data source. The result of the expression is treated as though it were a real field stored in the data source.
You can use a WebFOCUS function in a DEFINE or in a COMPUTE to transform data from an existing field to create a new field. Each function accepts a different set of arguments that are added in parentheses after the function name.
DEFINEs are built from the field list in the data pane.
DEFINEs can be created in the following ways:
- In a Master File. These virtual fields are available whenever the data source is used.
- In a procedure. A virtual field that is created in a procedure lasts only for that procedure.
In this example, a new DEFINE field will be created that uses the DTRUNC function to supply the first day of the week for each sale date.
- Create a new chart or report in WebFOCUS Designer, using wf_retail_lite.mas as the data source.
On the WebFOCUS Home Page, on the Designer tab, click Chart or Report. In the Open dialog box, navigate to and select wf_retail_lite.mas and click Select.
WebFOCUS Designer opens.
- On the Field panel, right-click a field or click the menu next to the Dimensions area or Measures area, and then click New calculation.
- In the Calculator dialog box, click the Functions tab
 .
.The Function list appears, and displays the first available function category.
Note: If you create the new calculation by right-clicking a field, that field is automatically added to the calculator text area. For the present example, delete this text before continuing.
- Navigate to the DTRUNC function using one of the following methods:
- In the search box, type DTRUNC.
- Expand the function category drop-down menu, and select Date/Date-Time.
Double-click the DTRUNC function, or drag it into the Calculator text area.
The text area displays the function and identifies the required arguments, in this case, date and period. Notice that an example is provided in the space below the calculator text area.
- In the text area, inside the parentheses after DTRUNC, select the word date.
- In this space, specify the input date that will be used to provide the first day of the week. In this case, instead of a
single date, provide an entire date field, so that the DEFINE field will generate a value for each input date value.
Click the Fields tab
 to access the Field list. Under Dimensions, expand Sales_Related, Transaction Date, Simple, Sale,Day, and Sale Date Details, then double-click Sale,Date.
The Sale Date field is added as the first argument in the DTRUNC function, as shown in the following image.
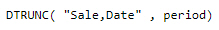
- Replace the word period with the date component that you want the field to use as increments. In this case, it is the first day of each week. Type
WEEK as the second argument in the DTRUNC function, in place of the period placeholder text. The completed function should resemble the following:
DTRUNC("Sale,Date", WEEK - Since the output of the DTRUNC function is a date field, the DEFINE field should use a date format.
Click the Edit format button, change the Date type to a date format, and select an option of your choice from the Date format drop-down menu.
Click OK.
- Optionally, double-click the name of the DEFINE field to change it.
- Click OK.
If you created the DEFINE by right-clicking a field in the Field panel, it displays at the bottom of the measure or dimension group where it was created from. If you have trouble locating your calculated field, type the name into the search box to find it.
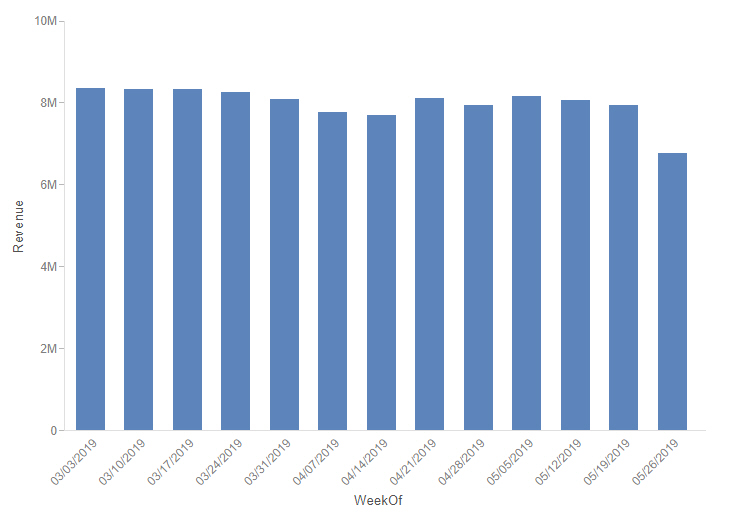
- Add the DEFINE to your chart or report as a sort field.
You can use the calculated field from this example to create a chart or report that shows sales information for each week, as shown in the following image.
Procedure: How to Create a COMPUTE Field
COMPUTEs are calculated fields whose values are evaluated after all of the data that meets the selection criteria is retrieved, sorted, and summed. The calculation uses the aggregated (total) values of the fields. For example, based on the values of Revenue and MSRP fields in your data source, you could calculate the discount percentage.
COMPUTE fields in a chart are built from fields that are located in the buckets. You can create a COMPUTE field in a report from a field in the report, or by clicking the menu next to the Rows bucket or the measure bucket.
- Create a new chart or report in WebFOCUS Designer, using wf_retail_lite.mas as the data source.
On the WebFOCUS Home Page, on the Designer tab, click Chart or Report. In the Open dialog box, navigate to and select wf_retail_lite.mas and click Select.
WebFOCUS Designer opens.
- On the Field panel, in the Measures area, expand the Sales folder, and double-click the Revenue field to add it to a measure bucket.
- From the measure bucket, right-click the Revenue field and click New calculation.
- In the Calculator dialog box, build the COMPUTE.
Note: The field that you right-click to create the COMPUTE field is automatically added to the text area, as shown in the following image.
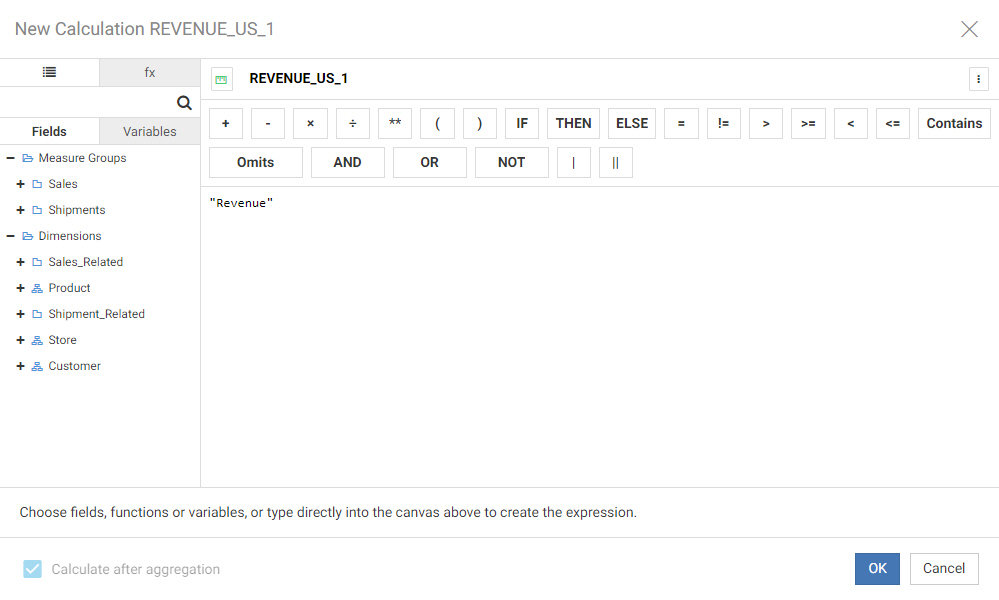
You can select another field or add fields from the data source tree that display.
Note: For COMPUTEs, the Calculate after aggregation check box is selected, by default, indicating that the field values are evaluated after the chart or report has been sorted. This check box is enabled for COMPUTE fields only.
- Type the mathematical expression to create a COMPUTE field to evaluate the discount percentage using the Revenue and MSRP
fields:
- Click to place your cursor before the Revenue field in the text area, and type 1 - (.
- Click to place your cursor after the Revenue field, and type /.
- From the data tree, under Measure Groups, expand the Sales folder and double-click the MSRP field to add it to the expression.
- Type ) to close the expression The completed expression for the COMPUTE field should resemble the following:
1 - ("Revenue"/"MSRP")The following image shows this expression in the Calculator.
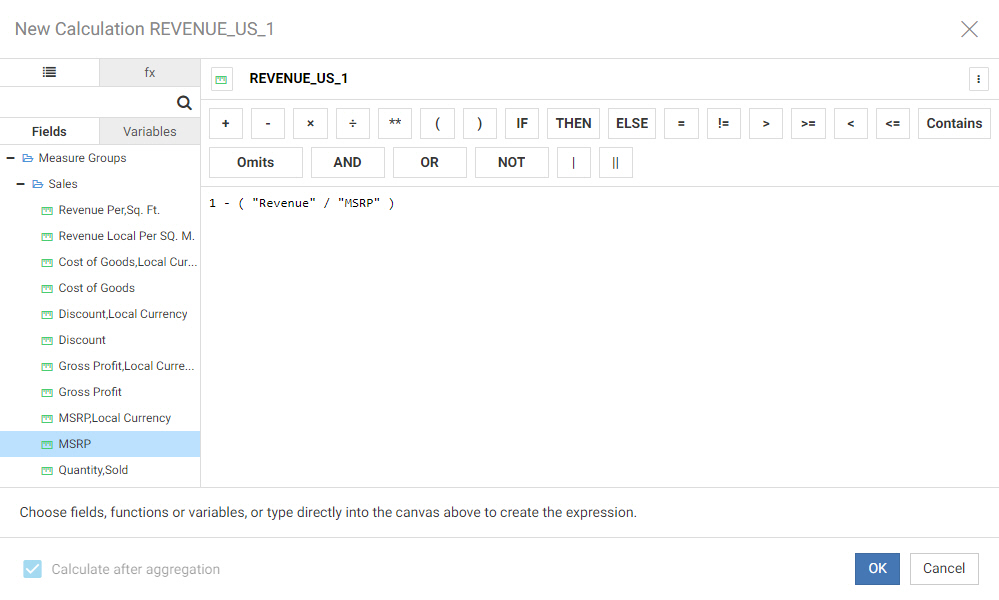
Note: You can use the buttons in the Operator Selection area instead of typing some mathematical operators.
- To show the discount percentage as percentage values instead of as a decimal, change the format of the calculation.
Click the Format icon to open the Format dialog box. Click the Percent Type option to change the field format to a percentage, as shown in the following image.
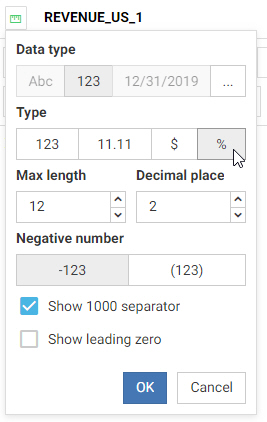
The percentage option automatically multiplies the values in the field by 100 to produce a percentage, so we do not need to perform this operation in the COMPUTE expression.
- Click OK to accept the field format change.
- Optionally, change the name of the COMPUTE field. It is assigned a default name based on where the COMPUTE field was created
from. Unless you specify a different column title, this name appears in the bucket where the COMPUTE is used and in your content.
Double-click the field name next to the Format icon, and type a new name for the field.
- Optionally, change the column title that displays for the COMPUTE field when it appears in your content.
Click the Field Properties menu, and type a column title for the field, as shown in the following image.
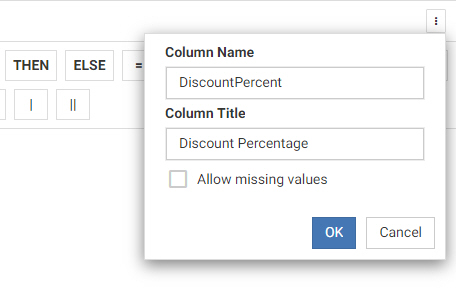
- Click OK to accept the new column title for the COMPUTE.
- Click OK to finish creating the new COMPUTE field.
The field is added to the same bucket from which you created it. You can move it to a different bucket or delete the original field, Revenue, in this example, from which it was created.
The following image shows a data grid that displays the Revenue and the calculated Discount Percentage for different product models.

If you remove the COMPUTE field from your content, it is deleted permanently. COMPUTE fields are not stored in the Field panel.
Procedure: How to Edit an Existing Calculation
Once you have created a calculated field (DEFINE or COMPUTE), you can edit it. This allows you to revise the calculation and in the field so that you can achieve the results you expect.
- Create a new chart using WebFOCUS Designer or open an existing WebFOCUS Designer chart.
- If you created a DEFINE field, the calculated field was added to the Field panel. In the Field panel, right-click the calculated
field and click Edit calculation.If you created a COMPUTE field, the calculated field was added directly to a bucket in the chart or report. Right-click the calculated field in a bucket, and click Edit calculation.
- Modify the calculated field.
- Click OK.
The revised field displays in the location from which you edited it.