|
In this section: |
|
How to: |
Available as a Technical Preview, you can use WebFOCUS Designer to create reports. Reports allow you to communicate information at a high level of detail using a familiar tabular format. You can save and share reports, add saved reports to pages, or edit existing reports created in WebFOCUS Designer. The Technical Preview provides basic reporting functionality within the easy to use Designer interface.
To enable the Technical Preview so that you can create reports using WebFOCUS Designer, on the WebFOCUS Home Page, expand the User menu, point to Administration and click Administration Console. In the Administration Console, from the navigation pane on the Configuration tab, click Other. On the Other page, type ALL in the Technical Preview Features field, and then click Save.
To create a report, on the WebFOCUS Home Page, select the domain or folder in which you want to save your content, and, on the Common or Designer tab of the Action bar, click Report.
You are then prompted to select a data source, which defines the fields that you can use to build the report. You can select a Master File (.mas) or a Reporting Object (.ro) as your data source. Reporting Objects help non-technical users see their data in a manner that is already filtered and refined, allowing you to limit the information that specific users can access when creating content in WebFOCUS. You can also upload a spreadsheet, CSV file, or other local file, or connect to an external data source.
You select your data from the Open dialog box, which has two tabs: Server and Repository. These tabs list data files based on where they are stored. Master Files are typically stored on the Server, while you can access Reporting Objects and Master File shortcuts from the Repository.
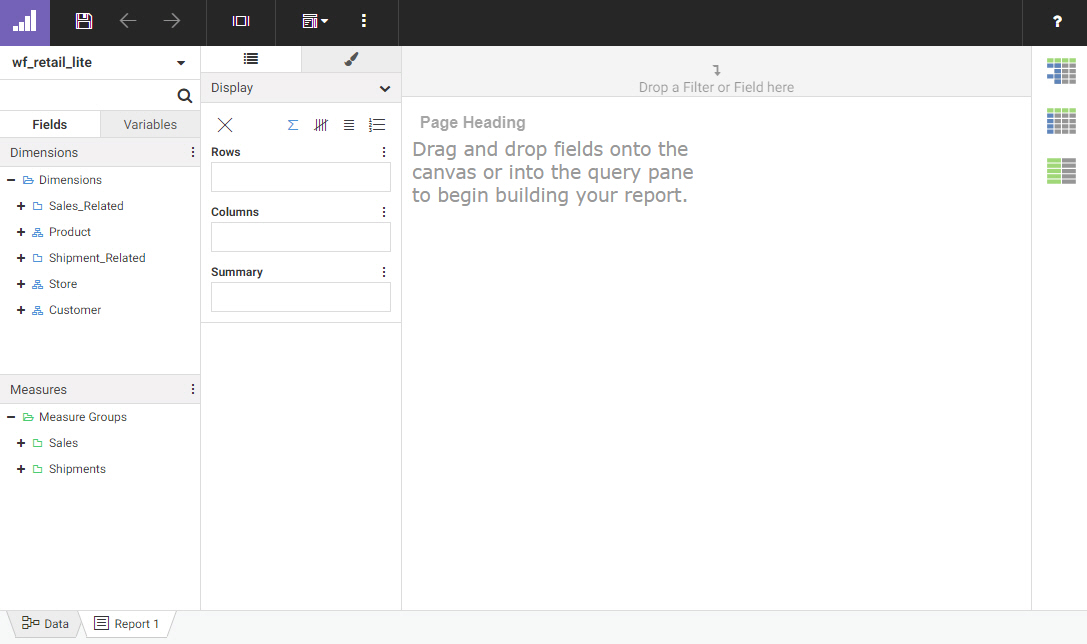
Once you have selected a data source, you are ready to begin creating a report. The following image shows the default WebFOCUS Designer interface when you create a report.
To populate the report, select measures and dimensions from the Fields tab, which displays the fields that were populated from your data source. You can add fields to your report in the following ways:
- Drag a field from the Fields tab to the canvas.
- Double-click a field in the Fields tab.
- Drag a field from the Fields tab into a bucket.
- Right-click a field on the Fields tab and click Add to report.
When you add a field to your report, the canvas updates to display the values in it.
You can define the rows and columns in a report by adding fields to the Rows and Columns buckets, respectively. Typically, these are dimension fields. The values in these fields are used to sort the report.
You can display aggregated values in a report by adding fields to the Summary bucket. This bucket is usually used to display values for measure fields. The Summary bucket displays by default, but you can change the bucket by selecting a different display option. The available display options are shown in the following image.
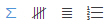
The Summary and Count options provide aggregated measure values for each sort value, that is, each row or column, in the report. The Detail and Detail with counter display options, on the other hand, provide a complete list of every value for the selected field or fields.
Once you have added fields to the report, you can format it to enhance its appearance or style. For example, you might want
to add a header and footer to identify the information on each page of the report, or use a report template to modify the
layout. You can also click the Style tab  to apply a theme or change the output format of the report.
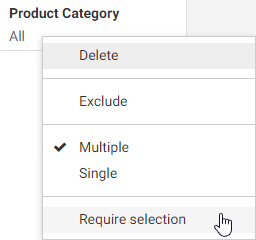
You can filter a report using a prompted filter. To create a filter, drag a field from the Fields tab to the Filter toolbar. When you click the filter on the Filter toolbar, a menu appears, allowing you to select default filter values. When content with prompted filters is added to a page, you can create filter controls to allow users to select their own filter values at run time. You can also require user selection for a prompted filter, so that the report does not run until the user makes a filter selection, by right-clicking the filter in the toolbar and clicking Require selection, as shown in the following image.
 . To change your filter selections, click the hamburger control
  to reopen the filter panel, and then change the values selected in the filter controls.