In this section: |
An infographic is a way to convey an idea or metric in a compelling visual format. It uses images to share information and present complex concepts, such as business analytics, in a simple and approachable manner. Through the narratives of infographics, you can go beyond dashboards and visualizations, and extend your communication to the level of data storytelling, increase understanding of the subject matter, and make a lasting impression.
This topic introduces WebFOCUS Infographics, and describes how to create and edit an infographic, as well as share it with relevant audiences.
When you pair infographics with the power and reporting capabilities of WebFOCUS InfoAssist, you can populate your visuals with data from your corporate sources and adopt key elements that are specific to different audiences. You can take full advantage of WebFOCUS Reporting Objects, which enable you to create all of your filters and WHERE conditions once and then quickly apply them to different data elements in your infographic. You can also reuse the same infographic template and modify it using different parameters in your Reporting Objects to quickly show changing data narrative. Finally, use WebFOCUS ReportCaster to distribute your message across different users, while automatically personalizing information, and applying security rules.
The steps that you can use to create WebFOCUS Infographics are outlined in the following image.
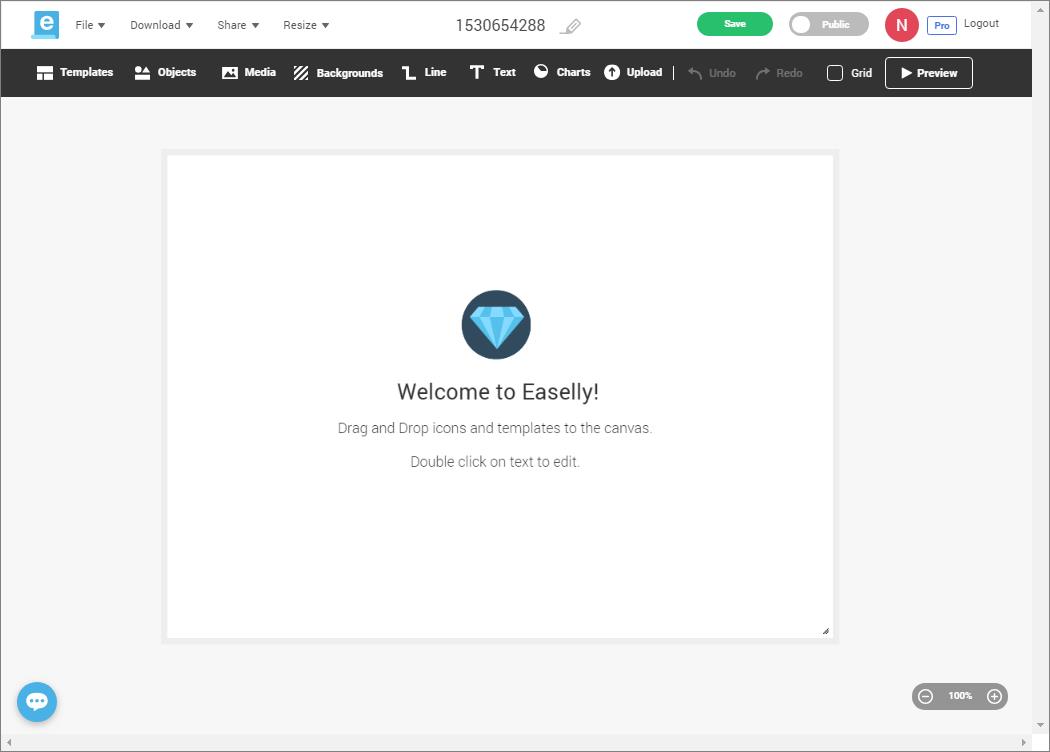
Your WebFOCUS Infographic begins as an outline. Once you have determined the information and story that you want to relay, you are ready to build a template, and create your infographic using WebFOCUS InfoAssist in Document mode.
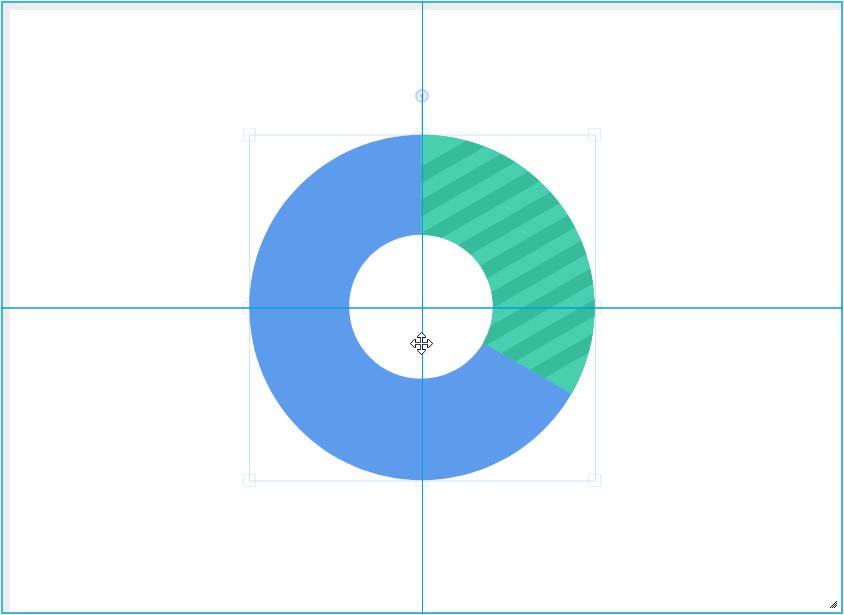
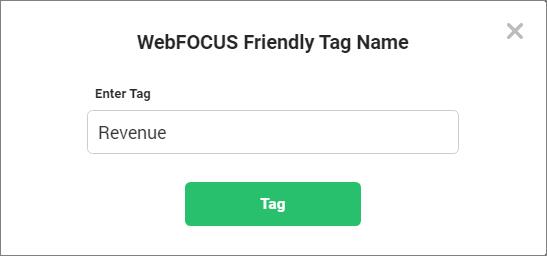
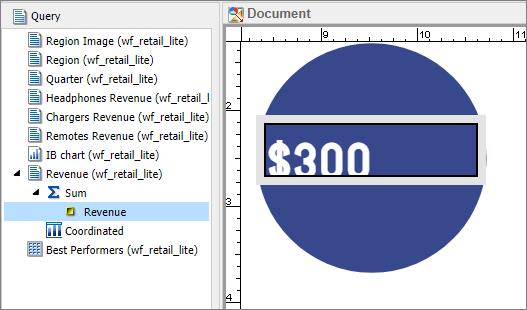
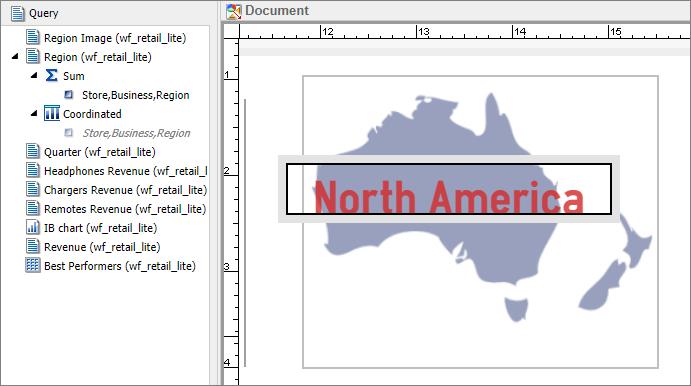
As you modify your infographic template, you identify and mark objects within the design so that they can be linked to WebFOCUS data through report and chart components. When you upload your infographic template and open it in InfoAssist, you create your infographic as a compound document. Each object you marked in the template becomes available as a component of the compound document. You can also leverage InfoAssist functionality to customize your infographic further.
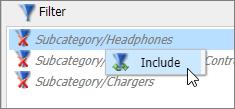
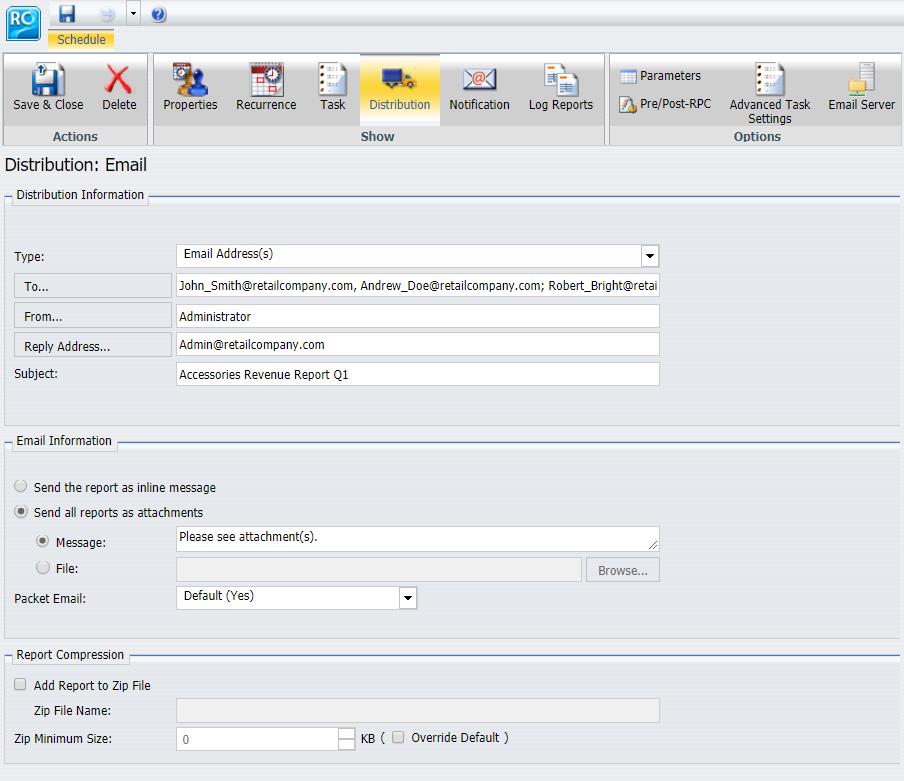
The final step is sharing your infographic with your target audience. You do this by scheduling your infographic procedure for distribution by email, FTP, to a printer, Report Library, or to the Repository. You can also distribute sections of the infographic procedure separately to the same or different destinations in your organization using the burst option in WebFOCUS ReportCaster. Bursting enables you to target relevant sections of a procedure to individual users. It uses data fields in the procedure that correspond to burst values that you specify in a Distribution List. For more information about bursting, see the ReportCaster Guide technical content.
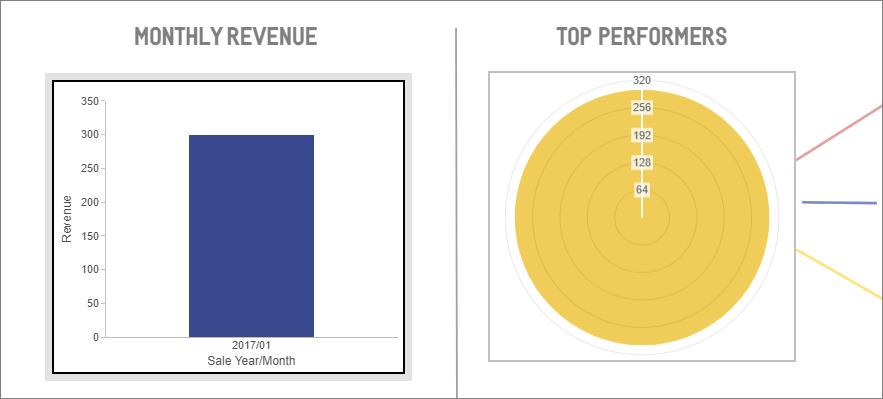
For example, you may need to create and share and infographic to relay quarterly revenue, highlight the most successful months, and identify the products that were most profitable during that time. Using WebFOCUS Infographics, you can create an infographic similar to the one shown in the following image, and customize it for regional managers in your company.
Because the infographic is geared for multiple regions of a retail electronics company, when sent, it automatically shows different text and data metrics depending on the region to which it is sent.
This content provides steps that you can use to create and share a WebFOCUS Infographic, using sample retail data that is available to you with your installation of WebFOCUS.
How to: |
Before you can begin creating infographic templates, you must first activate your WebFOCUS Infographics account. This activation requires you to register the site code associated with your Information Builders account that is licensed for WebFOCUS Infographics, as well as the corresponding email address and a password.
The WebFOCUS Infographics Sign In page opens, as shown in the following image.
Note: If you are already logged into the Technical Support Center or InfoResponse LIVE, you will not be prompted to log in again.
The WebFOCUS Infographics Registration page opens, as shown in the following image. Here, you can manage the site codes associated with your Information Builders account, and register the site codes that are licensed for WebFOCUS Infographics.
Once you have added your site codes, click Back to return to the WebFOCUS Infographics Registration page. The site codes that you added now display, and show those that are licensed for WebFOCUS Infographics, denoted with a checkmark.
You will receive an email notification within 24 hours that provides the details you need to activate your account.
This launches the WebFOCUS Infographics powered by Easelly dashboard, where you can choose from a library of infographics templates and get started, as shown in the following image.
Before you begin creating any infographic, you should outline the information you want to share, and build your story. This planning includes considering the following elements that contribute to the success of your message.
While developing your outline, collect any resources to support your infographic and make sure you have a good idea of the data that you intend to showcase. You can then create a wireframe of your infographic to help visualize the layout and aesthetics of the final product.
Once you have created your outline, you can build an infographic template that prepares it for use with WebFOCUS data.
How to: |
You can begin creating your infographic template, once you have registered your WebFOCUS Infographics account. This allows you to access to WebFOCUS Infographics powered by Easelly, which provides a library of infographic templates, and a design tool that contains a WebFOCUS tag option and placeholder objects that can be linked to WebFOCUS charts once you upload your template into WebFOCUS.
You can access the Creation Tool in one of the following ways:
When you sign in with your account, you can immediately begin using the extensive resource library of templates and user-created public visuals, as shown in the following image.
You can choose any template and adapt it to fit your purpose. You can also select a blank canvas, and build your template from scratch. Once you select a template, the Creation Tool opens. The following image shows an example of the WebFOCUS Infographics Creation Tool view with the blank template.
You can begin to customize your infographic template using the options that are available to you on the ribbon, which is shown in the following image.
From the ribbon, you can:
Note: The chart options include a WebFOCUS chart placeholder that you can fill with a WebFOCUS chart in InfoAssist.
Note: The supported formats are .gif and .png.
You can use the File, Download, Share, and Resize menus, which are shown in the following image, to save your template to your own local directory, download it in various formats, resize it, share it, invite other users to collaborate with your design, view your template in the browser, export your template to WebFOCUS, and modify the size of your template.
The canvas is interactive. As you drag an object from the ribbon, the canvas automatically displays placement lines that you can use to position the object, as shown in the following image.
When you click an object on the canvas, the ribbon expands and shows additional options that you can use to modify the object. For example, if you click a text box, the following options become available.
The options available to you change, depending on the type of object you select. For example, these options may include:
Note: This option is not yet available for use with WebFOCUS data.
Note: The color option is only available for single-tone icons and images and text objects.
Note: If you have not registered your WebFOCUS Infographics account, click Register here.
Alternatively, select Blank Template, if you want to build your own infographic template.
The template opens in a new window with features that you can use to edit it.
Using the ribbon options, you can manipulate a template in the following ways:
The WebFOCUS Friendly Tag Name dialog box opens. Here, you can assign a name to the object. These names appear in the InfoAssist Query pane as components, such as charts or reports in the compound document. The more descriptive the tags, the easier it is to identify components, and connect your data to those components in InfoAssist.
Note: You can add WebFOCUS tags to text, images, icons, or charts.
In our example, we define points of revenue for each consecutive year to ensure that the tag can be easily identified when we upload the template into InfoAssist. The tag, in this case, Revenue, is used as the name of the component in Document mode in InfoAssist.
A star appears next to the object that you tagged, indicating that the tag has been applied, as shown in the following image.
In our example, we added four alternating map images as watermarks for each region title. In the template, however, we only needed one image as a placeholder. When you connect this object to data in InfoAssist, you can create a simple DEFINE expression to automate the changing images at run time. To add a watermark image to your template:
Note: You do not need to upload all your alternating images, but make sure they are approximately the same size.
The following image shows an example of a completed template.
Click outside the text box to save the edit.
Type a name for your template in the Enter a name field, and click Save.
When you return to the Creation Tool, the new name of your infographic template appears.
The pop-up message appears, informing you that the download is ready to import into WebFOCUS, as shown in the following image.
Note: When you download the infographic template for use in WebFOCUS, a copy of the template saves to the Downloads folder on your machine, following the standard of each individual browser. If you download the file more than once, it does not overwrite the previously downloaded version, and appends it with a number that increases each time you download it. For example, if you name your template Infographic, it saves as Infographic.ely. If you download the same template a second time, it saves as Infographic (1).ely. You can continue to enhance your template and infographic procedure by overwriting the old template with your updated download. As long as the template name remains the same, the linked infographic procedure will continue to reference it. To ensure this link stays in place, delete the previous .ely file from the Downloads folder before you issue a new download, or rename the template before uploading it.
How to: |
You add data to your infographic template using WebFOCUS InfoAssist. When you open the infographic template in InfoAssist, it becomes a compound document. Specifically, each object that you marked with a WebFOCUS tag in the template becomes a component of the compound document, where you can add your data. Text objects become report components, where you can add the data field to the SUM field container or Header. Image objects become report components that are replaced by a binary large object (BLOB) database reference, a field reference that contains the name of an image file in a Reporting Server application path, or an external URL. Basic chart objects become WebFOCUS grid charts, and WebFOCUS chart objects become chart components that use the standard charting functionality available in InfoAssist.
You can add data to your infographic with InfoAssist in one of two ways:
Note: In the example used throughout this topic, we used a Reporting Object to create Where conditions that narrowed down our data to only show a specific quarter and product category.
The WebFOCUS Home Page opens.
The file uploads to your domain folder.
In our example, we used wf_retail.mas.
The Reporting Object interface opens, as shown in the following image.
Here, you can create Where statements and filtering conditions for your infographic. These Where statements are applied to the infographic, but remain invisible. Filters, instead, appear in InfoAssist, and can be manually included or excluded for each individual component.
The Create a filtering condition dialog box opens.
The Reporting Object Filter Group dialog box opens.
The filter group appears below the Filters node, as shown in the following image.
The Reporting Object Filter dialog box opens.
The Create a filtering condition window opens.
For example, if you want to refine the view of your data, you can create a filter to specify that Product Subcategory, when used, should equal Chargers, Universal Remote Controls, or Headphones. An example of these configured filters is shown in the following image.
The Reporting Object dialog box opens and displays the list of the available Reporting Objects, as shown in the following image.
InfoAssist opens in Document mode, and your template loads on the canvas. Notice that the WebFOCUS-tagged objects on the canvas correspond to the components in the Query pane. In the following image, the Region Image object is selected, and is shown as a report component in the Query pane with Sum and Coordinated field containers that can accept data values.
You can now build a WebFOCUS procedure that connects the infographic with your data.
The data component for this object opens in the Query pane, as shown in the following image.
When the canvas refreshes, it displays the data, as shown in the following image.
Notice that if you created Where statements in the Reporting Object, all your data is automatically narrowed down to those parameters.
To do this, we enabled the individual filters in the Filter pane, as shown in the following image.
Note: In InfoAssist, you can aggregate measure fields so they display as percentages, sums, averages, or several other value types. To do this, right-click a measure field, point to More, point to Aggregation Functions, and then select one of the options.
The Color window opens.
An example of completed charts is shown in the following image.
In our example, we highlighted Region on the canvas and dragged Store,Business,Region to Sum. The component now reflects the field data, as shown in the following image.
You can also modify the image that each user sees when you burst the infographic. For example, if you want to display an individual image for each region, you would create a Define that points to different image files that you upload to the Reporting Server application path.
For example, if you want to create a variable word in the introduction text component that changes for each region when the infographic is distributed, you can do this, using the following steps:
The Header & Footer dialog box opens.
Drag any field from the data pane into the canvas to incorporate it into the text.
In our example, we replaced the word Region (variable) with the Store,Business,Region field, so the message reflected the region of our recipient, as shown in the following images.
The text portion changes to reflect the field value, as shown in the following image.
In our example, we wanted to coordinate our data by region, so each Regional Manager received a specific revenue report narrowed down to their area. To do this, we dragged Store,Business,Region in to a Coordinated field container in the Query pane.
The infographic runs in the preview mode.
Since our example was created for bursting, the preview displays four versions of the infographic, one for each region. In each version, the values, headlines, and images relate to each of the four regions in our data, as shown in the following images.
You can use the same principle to generate bursts by any other field or metric, and distribute a different infographic to different stakeholders. For example, you could distribute new versions for each quarter, or change the Product Category represented to highlight other areas of the product line.
You can now share your infographic with others by email, in a form of an email burst across different groups of stakeholders, as well as publishing or sharing it in the WebFOCUS Repository.
The Open dialog box opens and displays the list of Master Files that are available to you, as shown in the following image.
The infographic template opens in InfoAssist Document mode, where you can connect it to your data.
You are now ready to share it with others.
How to: |
You can modify your infographic at any time to reflect new data that is available to you. For example, you may create an infographic that sends information monthly or quarterly. Once you set up the initial infographic template, and Reporting Object, you can easily distribute an updated infographic.
In our example, we created an infographic for the first quarter of a year. You can reuse the same template and Reporting Object for subsequent quarters without making any extensive changes. All you need to do is modify the Reporting Object so it uses data for a new quarter.
The Reporting Object interface opens.
Note: If you rename your Reporting Object, the infographic will not run. If needed, create a backup of the Reporting Object before you edit it.
Once you have edited your Infographic, you are ready to share it with others.
How to: |
You can make your newly created WebFOCUS Infographic available to other users by publishing it in your repository, sharing it with specific users and groups, or by distributing it using WebFOCUS ReportCaster. You can also distribute it using the burst option, which enables you to share specific sections of the infographic procedure with different users, based on the coordinated field in our infographic compound document. The following steps outline how you can share your infographic by email or burst it to members of your organization.
The ReportCaster Basic Scheduling tool opens, and you can specify how you want to distribute your Infographic. You can send the same infographic or infographics to everyone on a Distribution List or you can burst personalized instances of your infographic to different people, based on the values in your infographic.
For more information on bursting, see the ReportCaster Guide.
You can send your infographic inline, or as an attachment, by selecting the corresponding option under the Email Information section.
Note: For the Burst Report to operate successfully, you must define a coordinated value in the infographic procedure you create in InfoAssist. Both the coordinated value and the Burst flag are required for successful distribution of the coordinated infographic.
The Save As dialog box opens.
Your distribution schedule is now available from the WebFOCUS Home Page. You can edit it at any time, or view the log file to ensure that it was successfully distributed.
|
WebFOCUS |