HTTP Request Headers and JVM Property Information

Monitoring the HTTP Request Info Page

Settings on the HTTP Request Info page display information about the HTTP or HTTPS headers returned to your browser, as shown in the following image.

The Http Request Info page displaying the current values assigned to fields in the HTTP Header.

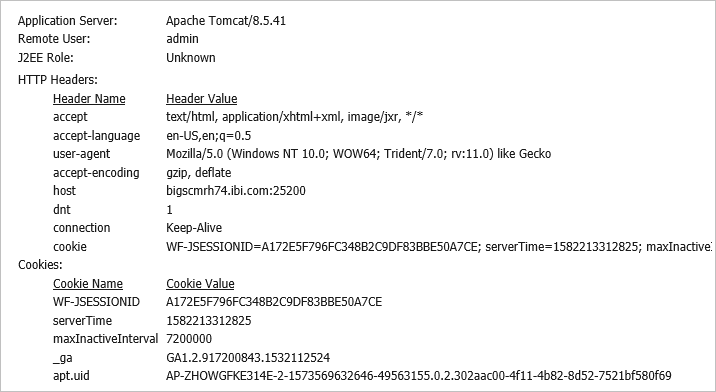
This information is useful for troubleshooting and HTTP header configuration, especially if you integrate Web Server or Application Server security with TIBCO WebFOCUS, or if your Web Server or Application Server uses virtual hosts (HTTP headers). The following information appears on this page.

Application Server. Identifies the name and version of the Application Server. For example, Apache Tomcat/9.0.26. Apache Tomcat is included in the product installation, by default, but a different name appears in this entry if your installation uses a different Application Server platform.

Remote User. Identifies the name of the user currently signed in to the session.

J2EE Role. Contains the value Unknown, by default. Typically, the J2EE role is not relevant.

The HTTP Headers section lists the fields and default values returned in the response from the Application Server to Browsers assigned to users in response to their initial requests. They define the acceptable operating parameters of the HTTP session.

The Cookies section lists the following information contained in cookies returned from the Application Server during the current session:

Monitoring the JVM Property Information Page

In this section:

Settings on the JVM Property Info page display information about the Java Virtual Machine®, also called the JVM, which supports your product installation. The JVM exists within the Random Access memory RAM of the machine that hosts the Application Server and Client, and the statistics that appear on this page refer to the performance of this installation.

Information on this page supports the analysis and troubleshooting of the Java environment for TIBCO WebFOCUS web applications and for the resolution of memory or resource issues.

This page contains links to two tabs. The Memory Information (K) tab displays current JVM memory usage statistics and system properties. The Monitoring JVM Performance tab contains a set of graphs that display patterns of memory usage over the previous hour.

This information can also be found in the JConsole monitoring tool, which is accessible in the Java Virtual Machine environment. However, by placing this information within the Administration Console, the JVM Property page saves you the time and effort required to open and access this information directly from Apache Tomcat® or your host server.

Monitoring the Memory Information (K) Tab

In this section:

The Memory Information (K) tab displays current memory usage statistics and additional System Properties for the Java Virtual Machine that runs your installation of TIBCO Web FOCUS, as shown in the following image.

The Memory Information (K) tab of the JVM Property Information page showing memory usage statistics and system properties.

Memory Usage Statistics Table

The table at the top of this tab shows current memory usage statistics for the installation of the Java Virtual Machine on the host that runs the Application Server and Client, as shown in the following image.

The table at the top of the Memory Information (K) tab of the Java Virtual Machine page showing memory usage statistics.

Values in this table show you the amount of memory currently in use in each of the following JVM memory areas.

The Heap memory area includes all class instances and arrays loaded into the JVM during run time. Therefore, the amount of memory allocated to the heap varies with the amount of user activity.

In the JVM, an internal Garbage Collection process automatically clears any class instances or arrays that are no longer in use. Classes and arrays that survive this process move from the Eden space, where all new classes and arrays are first loaded, to the Survivor space, and then to the Old Gen space. As a result, the table displays one row of summary statistics for the entire heap and three additional rows of statistics for the following three pools, or memory areas, within the heap.

  • PS Eden Space. Contains all new class instances and arrays.
  • PS Survivor Space. Contains class instances and arrays that survived the garbage collection process in the Eden Space because they continue to be in use.
  • PS Old Gen. Contains class instances and arrays that survived the garbage collection process in the Survivor Space because they continue to be in use.

The Non-heap memory area includes all threads and memory required to maintain internal JVM processing. Typically, this area is not subject to garbage collection, and the size of this area does not vary.

The table displays one row of statistics for the entire non-heap memory area and three additional rows of statistics for the following three pools:

  • Code Cache. Contains memory used to compile and store native code.
  • Metaspace. Contains metadata automatically loaded from classes created by users.
  • Compressed Class Space. Contains metadata about Java classes loaded by the applications.

The columns in this table represent the following statistics for each memory area.

  • Pool Name. Identifies the name of the memory area to which the statistics in the row apply.
  • Current Used. Identifies the amount of memory currently in use, in kilobytes, including the memory occupied by all objects, both reachable and unreachable.
  • Peak Used. Identifies the highest amount of memory, in kilobytes, used by the pool at any one time in the session.
  • Initial. Identifies the amount of memory, in kilobytes, used by the pool at the start of the session.
  • Committed. Identifies the amount of memory, in kilobytes, guaranteed to be available to the pool.
  • Maximum. Identifies the maximum amount of memory, in kilobytes, that can be made available to the pool.
  • Threshold Count. Identifies the memory usage threshold, in kilobytes.

Note that, instead of a count, the tilde character appears in the Peak Used column and the Threshold Count column for the Heap and Non-Heap rows, as shown in the following image.

The table at the top of the Memory Information (K) tab of the Java Virtual Machine page showing memory usage statistics and the tilde character in the Peak Used and Threshold Count entries for the Heap and Non-Heap rows.

This character indicates that summary statistics in these categories are not relevant to the overall Heap and Non-Heap memory areas. In all other columns, the number of kilobytes that appear in the Heap and Non-Heap rows are equal to the sum of the kilobytes that appear in the three rows beneath.

Understanding Entry Highlights

Individual entries in the Current Used and Peak Used columns are highlighted when the value in their category exceeds 90% of the maximum amount of memory that can be allocated to the pool, as shown in the Maximum column.

For example, if the number of kilobytes currently in use in the PS Old Gen pool of the heap exceeds 90% the Maximum amount, that entry will be highlighted with a background color, warning you that the number of existing classes in operation is close to the maximum amount of memory allocated to that pool.

Memory Allocation Guidelines

A standardized list of guidelines appears under the memory usage statistics table as shown below. This list advises you of the startup parameters to add to your JVM installation in order to set the optimum memory size for the Java startup parameters. Details in this list do not vary for each installation.

In this section, Xms refers to the -Xms parameter that defines the initial allocation of memory to the heap. Xmx refers to the -Xmx parameter that defines the maximum allocation of memory to the heap. XX refers to XX parameter that defines the minimum heap free ratio and the maximum heap free ratio.

System Properties List

The System Properties list appears at the bottom of the page. This list contains relevant parameters defined within the Java Virtual Machine and identifies the values assigned to them in your local installation of the Application Server and Client.

The System Properties list on the JVM Property Info page, listing values assigned to JVM parameters on the local installation of the Application Server and Client.

For more information about the specific properties listed here, see the Java Toolkit and Java® Virtual Machine Specification for your version of Java at https://docs.oracle.com/javase/specs/index.html.

The final four entries in this list are defined within TIBCO WebFOCUS and identify the encoding scheme used by your installation.

  • System.in Encoding. Identifies the current code page and encoding used by the Application Server.
  • System.out Encoding. Identifies the current code page and encoding used by the Application Server.
  • Method setCharacterEncoding. Identifies whether the use of character encoding is implemented or is not implemented.
  • Available Processors. The bit-size of the processors assigned to the machine that supports the JVM.

Monitoring JVM Performance

The Monitoring JVM Performance tab lists four graphs that display changes in usage of the CPU, Memory, Heap Memory, and Non-Heap Memory resources over the previous hour.

The Refresh button at the top of the page resets the graphs to display behavior from the hour prior to the time you select the button. You can use it to update the graphs to capture the most recent screen behavior.

The Refresh Interval check box and Refresh Interval second(s) field enable you to reset the frequency of the automatic refresh. The Refresh Interval is set to ten seconds, by default. You can replace this value with any number from 1 to 99,999,999. You can activate the automatic refresh by selecting the Refresh Interval check box.

The graphs on this tab support your performance monitoring and troubleshooting by quickly identifying unexpected peaks or troughs in resource usage and when, in the previous hour, they occurred.

CPU Usage History – 1 hour. Displays changes in the percentage of CPU resource usage during the previous hour, as shown in the following image.

  • Process CPU. Displays changes in the percentage of CPU resources used by JVM processes over the specified time period.
  • System CPU. Displays changes in the percentage of CPU resources used by operating system processes over the specified time period.
The CPU Usage History Graph on the Monitoring JVM Performance tab of the JVM Monitoring Info page.

Memory Usage History – 1 hour. Displays changes in the number of kilobytes used by the entire JVM application over the previous hour, as shown in the following image. The top entry in the graph displays the total number of kilobytes allocated to memory.

The Memory Usage History Graph on the Monitoring JVM Performance tab of the JVM Monitoring Info page.

Heap Memory Usage History – 1 hour. Displays changes in the number of kilobytes used by the heap memory over the previous hour, as shown in the following image. The top entry in the graph displays the total number of kilobytes allocated to heap memory.

The Heap Memory Usage History Graph on the Monitoring JVM Performance tab of the JVM Monitoring Info page.

Non-Heap Memory Usage History – 1 hour. Displays changes in the number of kilobytes used by the non-heap memory over the previous hour, as shown in the following image. The top entry in the graph displays the total number of kilobytes allocated to non-heap memory.

The Non-Heap Memory Usage History Graph on the Monitoring JVM Performance tab of the JVM Monitoring Info page.