Enabling Automatic Content Linking in WebFOCUS Designer With Auto Linking

In this section:

How to:

Auto Linking makes it easy to connect reports and charts in your development environment, expanding the reporting capabilities of your organization. Using Auto Linking, you can dynamically link multiple charts and reports with a single report or chart of any format, based on their common sort (BY) fields and parameters referenced in any filters. It is this commonality that dynamically links content in your WebFOCUS repository, allowing you to discover new possibilities in your data, and explore new relationships within your reporting enterprise. In addition, Auto Linking saves development time and effort, because drilldowns do not need to be manually created and maintained.

To use Auto Linking, you must use the AutoLink option in WebFOCUS Designer to set the reports or charts that provide Auto Linking drilldowns. In addition, you must also set reports or charts to be Auto Link targets. The options to enable and disable Auto Linking and Auto Link target functionality are available in the Content area, located beneath the buckets on the WebFOCUS Designer Properties panel.

Auto Linking and Auto Linking target status can only be enabled for stand-alone content items. If you convert a chart or report with Auto Linking to a page, a warning appears, alerting you that Auto Linking functionality will not be carried over.

Note: You can open an existing chart and enable Auto Linking or set the item as an Auto Link target.

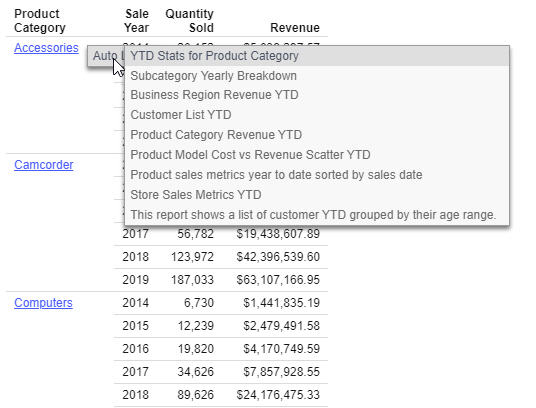
When Auto Link functionality is activated, tooltips in your charts can display links in the tooltip for each sort (BY) field with qualifying target reports or charts at run time. In Auto Link enabled charts, you can add sort (BY) fields to the Vertical Axis, Horizontal Axis, or Color field containers. In Auto Link enabled reports, Auto Linking drill-down links are added to each sort value for which there are Auto Link targets available.

To qualify a chart as an Auto Link target, you must include filters that contain the parameters that you selected as the sort field or fields in Auto Linking enabled content. The parameter names defined in these filters must be the same as the sort (BY) field names in the Auto Link enabled chart. For example, if you Auto Linking enabled content uses Product Category as a sort field, then the Auto Linking targets that are available will be those that have parameters for the Product Category field. When you select a chart as the Auto Link target, it specifies that the parameter information should be cataloged, and will be evaluated when an Auto Link enabled chart is run.

For an Auto Link enabled chart or report at run time, the target reports and charts are those that have filters with parameters for all sort fields. For run time for charts, the linked sort field values in the Auto Link enabled content is passed to the Auto Link target report or chart and used as a filter value.

For example, you may have an Auto Link enabled chart that contains sort (BY) fields, Product Category and Model, with a measure (Sum) field, Revenue. To qualify as an Auto Link target, other charts in your repository can contain a single filter with a parameter for Product Category, or two filters with parameters for both Product Category and Model. When you run the Auto Link enabled chart, the Product Category field will link to target reports or charts that have a filter with a parameter for Product Category, and the Model field will link to target reports or charts that have filters for both Product Category and Model.

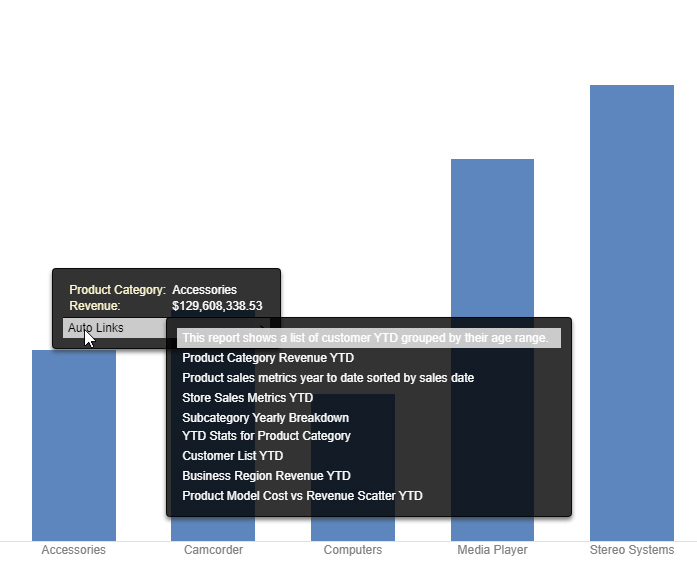
You can access the target reports or charts from a tooltip option that displays when you point your mouse over an area of the chart, such as a bar that represents Revenue by Product Category and by Model.
Using Optional Parameters With Auto Linking to Enhance Drill-Down Results

In addition to the basic Auto Linking functionality that is available in WebFOCUS Designer, you can also add optional parameters to your Auto Link charts, extending the capability of this feature. An Auto Link enabled chart can link to any target content that you are authorized to access that satisfies the sort (BY) field to the Auto Link target report filter parameter requirement. Auto Link target reports that satisfy this requirement and also have optional filter parameters for other fields are included in the Auto Link target report evaluation, so that all possible combinations of run-time parameters are evaluated and available as links as you run the request. This may produce additional reports or charts in your list of available Auto Link targets, offering you access to an expanded network of related content.

Setting a parameter to optional is not required because the Auto Link enabled content will pass the value for the fields being filtered to the Auto Link target report or chart. When a sort (BY) field value in an Auto Link enabled chart is selected, that value and the value of its parent sort fields are passed to the Auto Link target. When a measure value in a chart is selected, all sort (BY) field values for that measure are passed to the Auto Link target. If you select the Optional option, the Auto Link target report or chart can run on its own (from the Resources Tree or within InfoAssist InfoAssist) without being prompted by Autoprompt for a value for the parameter. This is because optional parameters are assigned a default value.

With Auto Linking, there is no limit to the number of charts and reports that are available from an Auto Linking drilldown, and Auto Linking enabled charts can also be an Auto Linking target, which contributes to the development of a cascading linkage of charts and allows you to drill through continuously through multiple charts and reports.

Note:
  • The linked reports and charts displayed are limited to those that you are authorized to run or run deferred.
  • The Auto Link enabled and Auto Link target options can be set individually, or both can be set on the same chart if that item meets the Auto Linking requirements.
  • Consideration should be given to how many reports or charts are indicated as Auto Link targets, as the run-time Multi-drill menu for the qualifying target reports or charts may become long in length. In these cases, some browsers may display a script processing warning message.
  • Auto Linking utilizes the Multi-drill feature with cascading menus, except when running an HTML report with On-demand Paging enabled or a chart request that is a legacy graph format (PFJ-based formats, such as PNG and non-bucket HTML5), which will display a single-level list in the order the drilldowns are specified in the request.
  • The Multi-drill cascading menu displays:
    • Horizontal lines to separate user-specified drilldowns and Auto Link navigation options.
    • Auto Link target reports in a single-level list that is sorted alphabetically, first by folder, and then the Auto Link target reports and charts within the folder. This may differ from the sort order of the resource tree that also applies the Properties Sort order option when sorting folders and items within folders.
  • When drilling down through a list of Auto Link target reports and charts, a previously selected Auto Link target report or chart will be excluded so that the available Auto Link targets are reports and charts that you have not yet viewed.

Procedure: How to Set an Existing Report or Chart as Auto Link Enabled

  1. On the WebFOCUS start page or the WebFOCUS Home Page, click the Workspaces tab, and navigate to a chart or report for which you want to enable Auto Linking.
  2. In the content area, right-click the chart that you want to set as Auto Link enabled, and then click Edit.

    WebFOCUS Designer opens in the relevant mode.

  3. Verify that there is a sort (BY) field in the report or chart.
    • For charts, sort fields are added to the Vertical, Horizontal, or Color buckets.
    • In a report, sort fields are added to the Rows bucket.
  4. On the Properties panel, on the Settings tab, expand Content, and then select AutoLink.
  5. Save the report or chart.

    Your existing chart or report is now Auto Link enabled.

Procedure: How to Set an Existing Chart as an Auto Link Target

  1. On the WebFOCUS start page or the WebFOCUS Home Page, click the Workspaces tab, and navigate to a chart or report that you want to link to as an Auto Link target.
  2. In the content area, right-click the chart that you want to set as an Auto Link target, and then click Edit.

    WebFOCUS Designer opens in the relevant mode.

  3. On the Properties panel, on the Settings tab, expand Content, and then select AutoLink target.

    Note: Selecting AutoLink target specifies that the parameter information for this chart will be stored, adding it to the repository of reports and charts that will be evaluated when an Auto Link enabled report is run.

  4. Verify if the report or chart has an existing filter, as qualifying target reports are those that have filters with parameters for the sort (BY) fields in Auto Link enabled reports or charts. If a filter does not exist, add a filter prompted filter to the target report or chart.
    1. From the Data pane, drag a sort (BY) field onto the Filter toolbar. You do not need to select a value.

      Note: When creating a parameter for a field, the parameter name defaults to the name of the field that you select. For example, if you create a filter for the Product Category field by dragging it to the Filter toolbar, the name of the resulting parameter is &PRODUCT_CATEGORY, reflecting the field name PRODUCT_CATEGORY. You can see the field name in the tooltip when you point to a field on the Fields pane.

  5. Save the chart.

    Your existing chart is now set as an Auto Link target.

Procedure: How to Create a New Auto Link Enabled Chart

  1. Open WebFOCUS Designer. On the WebFOCUS start page, click the plus menu and then click Create Visualizations, or, on the WebFOCUS Home Page, click Visualize Data.

    WebFOCUS Designer opens in a new browser tab.

  2. Select a workspace and a data source available from that workspace.

    Once you select a data source, WebFOCUS Designer loads with options to create a single content item.

  3. On the Settings tab of the Properties panel, expand the Content area, and then select AutoLink.
  4. Add fields to the report or chart, ensuring that one is a sort (BY) field.
    • For charts, sort fields are added to the Vertical, Horizontal, or Color field containers depending on the chart type.
    • For reports, sort fields are added to the Rows bucket.
  5. Save the chart.

    Your chart is now set as Auto Link enabled.

Procedure: How to Create a New Auto Link Target Chart

  1. Open WebFOCUS Designer. On the WebFOCUS start page, click the plus menu and then click Create Visualizations, or, on the WebFOCUS Home Page, click Visualize Data.

    WebFOCUS Designer opens in a new browser tab.

  2. Select a workspace and a data source available from that workspace.

    Once you select a data source, WebFOCUS Designer loads with options to create a single content item.

  3. On the Settings tab of the Properties panel, expand the Content area, and then select AutoLink target.

    Note: Selecting AutoLink target specifies that the parameter information for this chart will be stored, adding it to the repository of reports and charts that will be evaluated when an Auto Link enabled report is run.

  4. Add fields to the chart or report.
  5. Add a prompted filter.

    From the Data pane, drag a sort (BY) field onto the Filter toolbar.

    Note: When creating a parameter for a field, the parameter name defaults to the name of the field that you select. For example, if you create a filter for the Product Category field by dragging it to the Filter toolbar, the name of the resulting parameter is &PRODUCT_CATEGORY, reflecting the field name PRODUCT_CATEGORY. You can see the field name in the tooltip when you point to a field on the Fields pane.

  6. Save the chart or report.

    Your content is now available as an Auto Link target.

Running an Auto Link Enabled Chart

Auto Linking is supported from any WebFOCUS repository content, wherever it is run online.

Example: Launching an Auto Link Enabled Report

From the WebFOCUS start page or the WebFOCUS Home Page, right-click a chart that is Auto Link enabled, and then click Run.

Example: Using Hyperlinks to Link to Other Reports or Charts

Use the hyperlinks to link to other reports and charts, based on the following information:
  • Charts. Displays with aspects over which you can hover (for example, a bar) in the chart. A tooltip displays with the Auto Link target reports and charts, as shown in the following image.
  • Reports. Values pointing to Auto Link targets display as clickable links. When you click a link, a menu appears, allowing you to select a target to open, as shown in the following image.
Report with Auto Link menu