Procedure: How to Generate Instant Insights
You can generate visualizations that give you insights into your data.
- From the WebFOCUS Hub, click the plus menu, and then click Explore Data.
The Select Data Source dialog box opens, as shown in the following image.
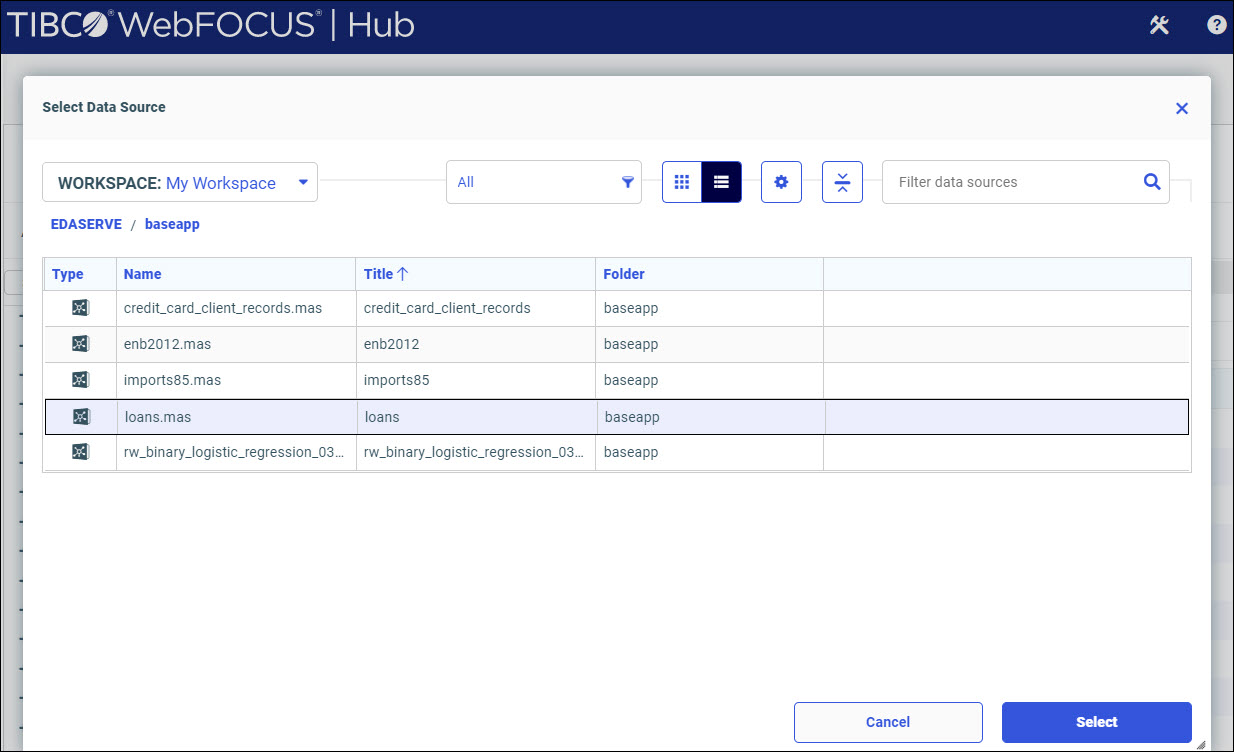
- Select a data source from which you want to generate insights.
Your insights are generated, as shown in the following image.
Note: Insights based on datasets with more than 100,000 records use representative sampling of 100,000 data points.
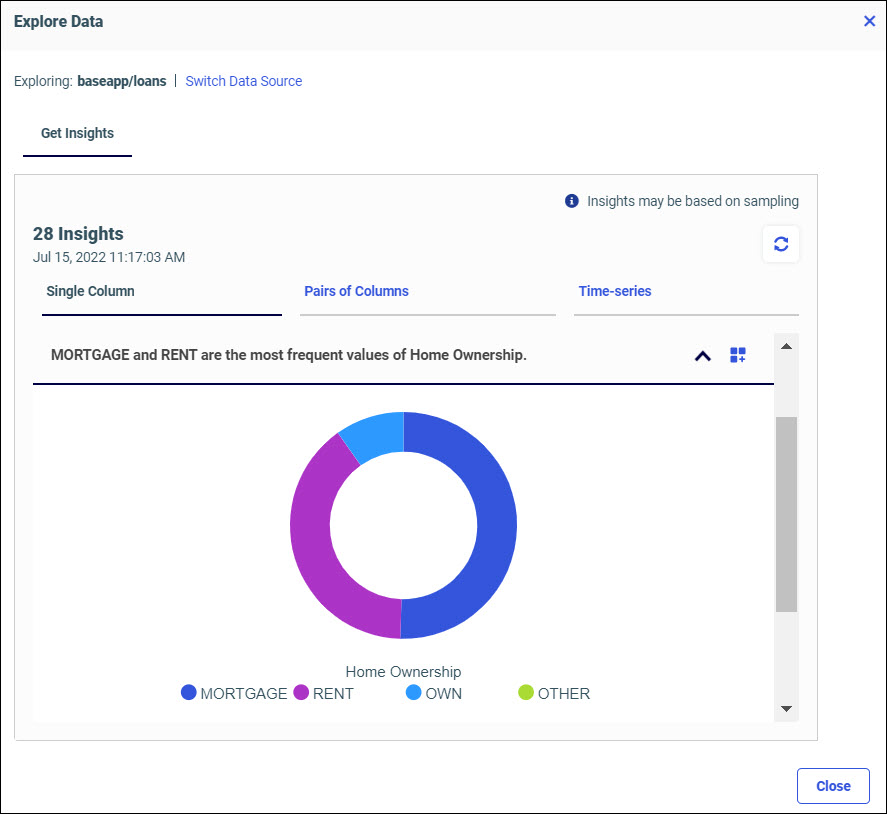
The total number of insights generated, with a time stamp, is displayed. If your data is dynamic, you can click the refresh icon to gain updated insights.
Your insights display as visualizations, or charts, in different accordions, which can be collapsed or expanded. Each insight includes an automated, header narrative that explains the trends in your data.
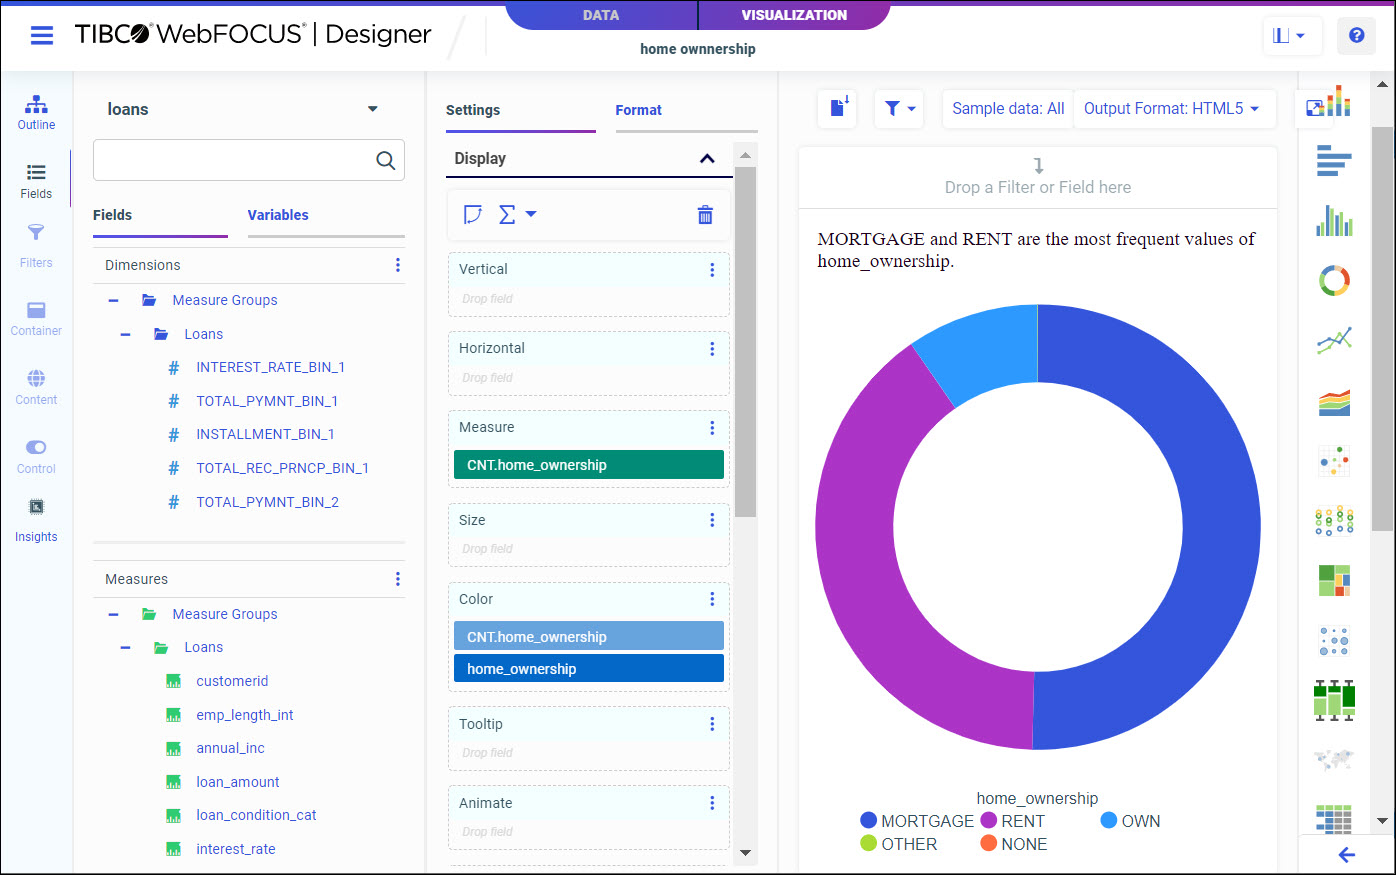
Click Switch Data Source to return to the Select Data Source dialog box. Click the Action icon to run your chart in a new window, or save your chart to a workspace. Click Close to return to the WebFOCUS Hub.
Depending on your data set, your insights are generated and categorized into the following tabs:
- Single Columns. Displays results for single columns of data. Insights can show dominance and distributions.
- Pairs of Columns. Displays results for pairs of columns of data. Insights can show correlations and associations.
- Time-series. Displays results for single columns of data that change over time. Insights can show seasonality, trend, and outliers.
For more information on types of generated insights and charts, see Generating Instant Insights in TIBCO WebFOCUS Designer.