Working With TIBCOWebFOCUS Diagnostics

In this section:

How to:

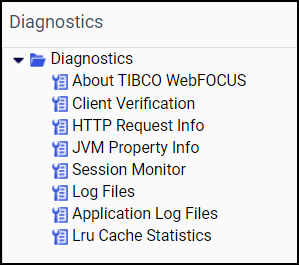
Using the Diagnostics menu of the Administration Console, users whose privileges allow them to view the Administration Console can:

The Diagnostics menu is shown in the following image.

The diagnostics tab menu.

Reviewing Version Information

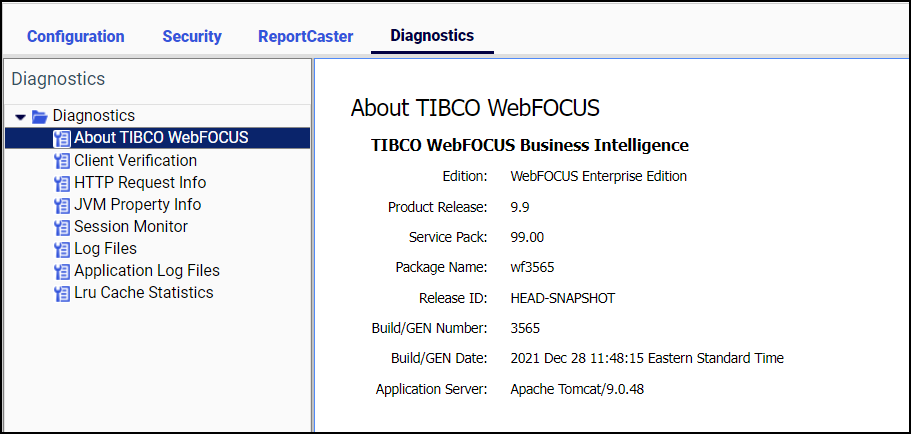
The About TIBCO WebFOCUS page displays information about the release you are using and the optional components installed with it, as shown in the following image.

The About WebFOCUS page displaying information about the current release.

You can use the information on this page to identify your current product release and service pack when corresponding with the Information Builders Customer Support team.

When you select About TIBCO WebFOCUS, the following information appears in the main window:

Edition. Product edition, for example, WebFOCUS Enterprise Edition.

Product Release. Release number, for example, 8.2.

Service Pack. Service pack number, for example, 05.01 The first and second digits represent the version number. The third and fourth digits represent the interim release version number.

Package Name. Installation file package name, for example, wf032019a.

Release ID. Product release number, for example, 8205.

Build/GEN Number. Specific product build number, for example, 74.

Build/GEN Date. Date and time the build number was generated, for example, March 20, 2019 8:04:35 PM EDT.

Application Server. Application Server, for example, Apache Tomcat/8.5.32.

This version of the About TIBCO WebFOCUS page, that opens from the Diagnostics tab, is only available to those users whose privileges allow them to open and review the Administration Console.

However, the product and application server information on this page is also available to those users whose privileges allow them to view the About TIBCO WebFOCUS Business Intelligence window. To open this other window, select Help, and then click About WebFOCUS.
Reviewing Client Verification

The Client Verification page displays the current status of client configuration and application settings. When you open this page, the tests required to verify that configuration and application settings are open and available are conducted automatically.

Settings marked pass are available for use. Settings marked fail are not available for use.

The automated verification process includes a validation of web server aliases and directory permissions for each type of client communication mode (CGI, WFServlet, or ISAPI).

The Client verification tools, by default, place the verification logs in the drive:\ibi\WebFOCUS82\logs directory. These tools test read, write, and remove permissions for the logs directory. They also test read and write permissions for the drive:\ibi\WebFOCUS82\config directory.

To test a Server connection and the current status of the Graph or Table functionality it can deliver, you must open the Configuration tab, and right-click the icon for the Server you wish to test. All three tests are available on the shortcut menu assigned to each server node.

Procedure: How to Run a Client Verification Test

In the Administration Console, click Diagnostics, and then click Client Verification.

The Client Verification page displays your directory permissions, such as creating and deleting applications, signing in as the administrator, reading and writing from the standard directories, creating and deleting workspaces, and creating and deleting reports.

Note: If you run this test immediately after performing the installation procedure, there might be a delay resulting from a slow or delayed first time initialization of the Tomcat Web Application that supports client operations.

Monitoring the HTTP Request Info Page

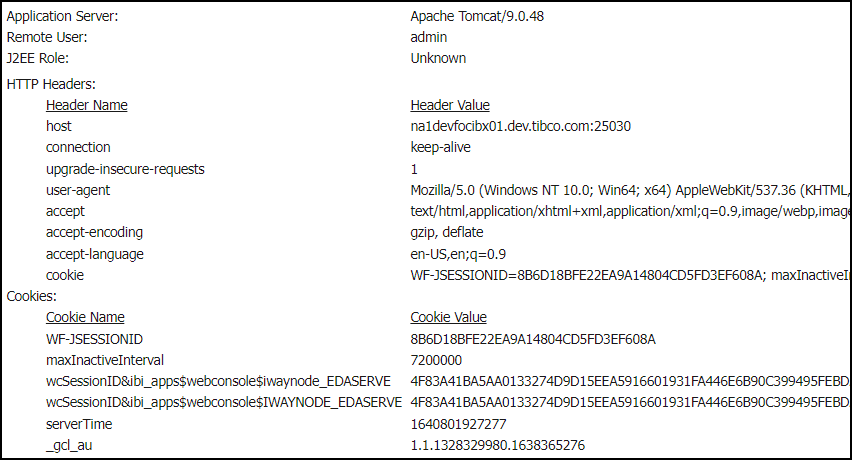
Settings on the HTTP Request Info page display information about the HTTP or HTTPS headers returned to your browser, as shown in the following image.

The Http Request Info page displaying the current values assigned to fields in the HTTP Header.

This information is useful for troubleshooting and HTTP header configuration, especially if you integrate Web Server or Application Server security with TIBCO WebFOCUS, or if your Web Server or Application Server uses virtual hosts (HTTP headers). The following information appears on this page.

Application Server. Identifies the name and version of the Application Server. For example, Apache Tomcat/9.0.26. Apache Tomcat is included in the product installation, by default, but a different name appears in this entry if your installation uses a different Application Server platform.

Remote User. Identifies the name of the user currently signed in to the session.

J2EE Role. Contains the value Unknown, by default. Typically, the J2EE role is not relevant.

The HTTP Headers section lists the fields and default values returned in the response from the Application Server to Browsers assigned to users in response to their initial requests. They define the acceptable operating parameters of the HTTP session.

The Cookies section lists the following information contained in cookies returned from the Application Server during the current session:

Monitoring the JVM Property Information Page

In this section:

Settings on the JVM Property Info page display information about the Java Virtual Machine®, also called the JVM, which supports your product installation. The JVM exists within the Random Access memory RAM of the machine that hosts the Application Server and Client, and the statistics that appear on this page refer to the performance of this installation.

Information on this page supports the analysis and troubleshooting of the Java environment for TIBCO WebFOCUS web applications and for the resolution of memory or resource issues.

This page contains links to two tabs. The Memory Information (K) tab displays current JVM memory usage statistics and system properties. The Monitoring JVM Performance tab contains a set of graphs that display patterns of memory usage over the previous hour.

This information can also be found in the JConsole monitoring tool, which is accessible in the Java Virtual Machine environment. However, by placing this information within the Administration Console, the JVM Property page saves you the time and effort required to open and access this information directly from Apache Tomcat® or your host server.

Monitoring the Memory Information (K) Tab

In this section:

The Memory Information (K) tab displays current memory usage statistics and additional System Properties for the Java Virtual Machine that runs your installation of TIBCO WebFOCUS, as shown in the following image.

The Memory Information (K) tab of the JVM Property Information page showing memory usage statistics and system properties.

Memory Usage Statistics Table

The table at the top of this tab shows current memory usage statistics for the installation of the Java Virtual Machine on the host that runs the Application Server and Client, as shown in the following image.

The table at the top of the Memory Information (K) tab of the Java Virtual Machine page showing memory usage statistics.

Values in this table show you the amount of memory currently in use in each of the following JVM memory areas.

The Heap memory area includes all class instances and arrays loaded into the JVM during run time. Therefore, the amount of memory allocated to the heap varies with the amount of user activity.

In the JVM, an internal Garbage Collection process automatically clears any class instances or arrays that are no longer in use. Classes and arrays that survive this process move from the Eden space, where all new classes and arrays are first loaded, to the Survivor space, and then to the Old Gen space. As a result, the table displays one row of summary statistics for the entire heap and three additional rows of statistics for the following three pools, or memory areas, within the heap.

  • PS Eden Space. Contains all new class instances and arrays.
  • PS Survivor Space. Contains class instances and arrays that survived the garbage collection process in the Eden Space because they continue to be in use.
  • PS Old Gen. Contains class instances and arrays that survived the garbage collection process in the Survivor Space because they continue to be in use.

The Non-heap memory area includes all threads and memory required to maintain internal JVM processing. Typically, this area is not subject to garbage collection, and the size of this area does not vary.

The table displays one row of statistics for the entire non-heap memory area and three additional rows of statistics for the following three pools:

  • Code Cache. Contains memory used to compile and store native code.
  • Metaspace. Contains metadata automatically loaded from classes created by users.
  • Compressed Class Space. Contains metadata about Java classes loaded by the applications.

The columns in this table represent the following statistics for each memory area.

  • Pool Name. Identifies the name of the memory area to which the statistics in the row apply.
  • Current Used. Identifies the amount of memory currently in use, in kilobytes, including the memory occupied by all objects, both reachable and unreachable.
  • Peak Used. Identifies the highest amount of memory, in kilobytes, used by the pool at any one time in the session.
  • Initial. Identifies the amount of memory, in kilobytes, used by the pool at the start of the session.
  • Committed. Identifies the amount of memory, in kilobytes, guaranteed to be available to the pool.
  • Maximum. Identifies the maximum amount of memory, in kilobytes, that can be made available to the pool.
  • Threshold Count. Identifies the memory usage threshold, in kilobytes.

Note that, instead of a count, the tilde character appears in the Peak Used column and the Threshold Count column for the Heap and Non-Heap rows, as shown in the following image.

The table at the top of the Memory Information (K) tab of the Java Virtual Machine page showing memory usage statistics and the tilde character in the Peak Used and Threshold Count entries for the Heap and Non-Heap rows.

This character indicates that summary statistics in these categories are not relevant to the overall Heap and Non-Heap memory areas. In all other columns, the number of kilobytes that appear in the Heap and Non-Heap rows are equal to the sum of the kilobytes that appear in the three rows beneath.

Understanding Entry Highlights

Individual entries in the Current Used and Peak Used columns are highlighted when the value in their category exceeds 90% of the maximum amount of memory that can be allocated to the pool, as shown in the Maximum column.

For example, if the number of kilobytes currently in use in the PS Old Gen pool of the heap exceeds 90% the Maximum amount, that entry will be highlighted with a background color, warning you that the number of existing classes in operation is close to the maximum amount of memory allocated to that pool.

Memory Allocation Guidelines

A standardized list of guidelines appears under the memory usage statistics table as shown below. This list advises you of the startup parameters to add to your JVM installation in order to set the optimum memory size for the Java startup parameters. Details in this list do not vary for each installation.

In this section, Xms refers to the -Xms parameter that defines the initial allocation of memory to the heap. Xmx refers to the -Xmx parameter that defines the maximum allocation of memory to the heap. XX refers to XX parameter that defines the minimum heap free ratio and the maximum heap free ratio.

System Properties List

The System Properties list appears at the bottom of the page. This list contains relevant parameters defined within the Java Virtual Machine and identifies the values assigned to them in your local installation of the Application Server and Client.

The System Properties list on the JVM Property Info page, listing values assigned to JVM parameters on the local installation of the Application Server and Client.

For more information about the specific properties listed here, see the Java Toolkit and Java® Virtual Machine Specification for your version of Java at https://docs.oracle.com/javase/specs/index.html.

The final four entries in this list are defined within TIBCO WebFOCUS and identify the encoding scheme used by your installation.

  • System.in Encoding. Identifies the current code page and encoding used by the Application Server.
  • System.out Encoding. Identifies the current code page and encoding used by the Application Server.
  • Method setCharacterEncoding. Identifies whether the use of character encoding is implemented or is not implemented.
  • Available Processors. The bit-size of the processors assigned to the machine that supports the JVM.

Monitoring JVM Performance

The Monitoring JVM Performance tab lists four graphs that display changes in usage of the CPU, Memory, Heap Memory, and Non-Heap Memory resources over the previous hour.

The Refresh button at the top of the page resets the graphs to display behavior from the hour prior to the time you select the button. You can use it to update the graphs to capture the most recent screen behavior.

The Refresh Interval check box and Refresh Interval second(s) field enable you to reset the frequency of the automatic refresh. The Refresh Interval is set to ten seconds, by default. You can replace this value with any number from 1 to 99,999,999. You can activate the automatic refresh by selecting the Refresh Interval check box.

The graphs on this tab support your performance monitoring and troubleshooting by quickly identifying unexpected peaks or troughs in resource usage and when, in the previous hour, they occurred.

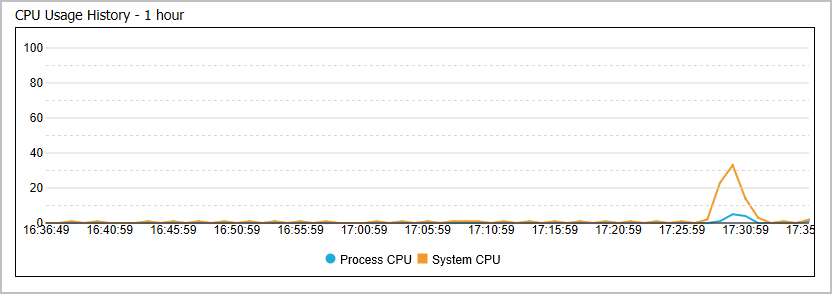
CPU Usage History – 1 hour. Displays changes in the percentage of CPU resource usage during the previous hour, as shown in the following image.

  • Process CPU. Displays changes in the percentage of CPU resources used by JVM processes over the specified time period.
  • System CPU. Displays changes in the percentage of CPU resources used by operating system processes over the specified time period.
The CPU Usage History Graph on the Monitoring JVM Performance tab of the JVM Monitoring Info page.

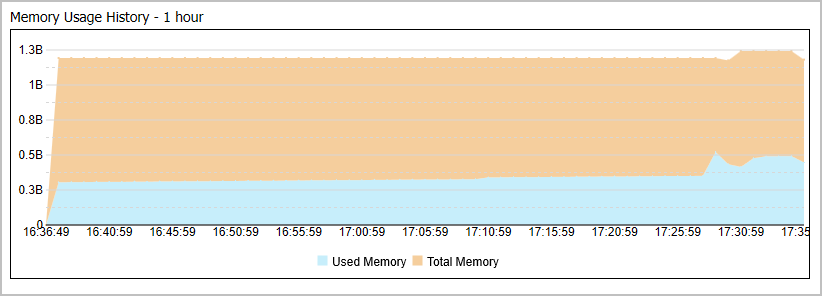
Memory Usage History – 1 hour. Displays changes in the number of kilobytes used by the entire JVM application over the previous hour, as shown in the following image. The top entry in the graph displays the total number of kilobytes allocated to memory.

The Memory Usage History Graph on the Monitoring JVM Performance tab of the JVM Monitoring Info page.

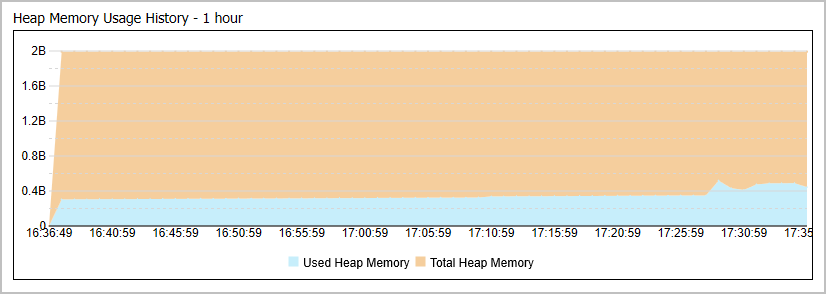
Heap Memory Usage History – 1 hour. Displays changes in the number of kilobytes used by the heap memory over the previous hour, as shown in the following image. The top entry in the graph displays the total number of kilobytes allocated to heap memory.

The Heap Memory Usage History Graph on the Monitoring JVM Performance tab of the JVM Monitoring Info page.

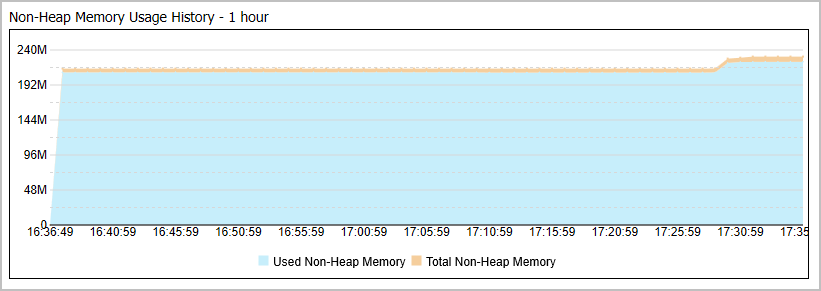
Non-Heap Memory Usage History – 1 hour. Displays changes in the number of kilobytes used by the non-heap memory over the previous hour, as shown in the following image. The top entry in the graph displays the total number of kilobytes allocated to non-heap memory.

The Non-Heap Memory Usage History Graph on the Monitoring JVM Performance tab of the JVM Monitoring Info page.

Monitoring Sessions

How to:

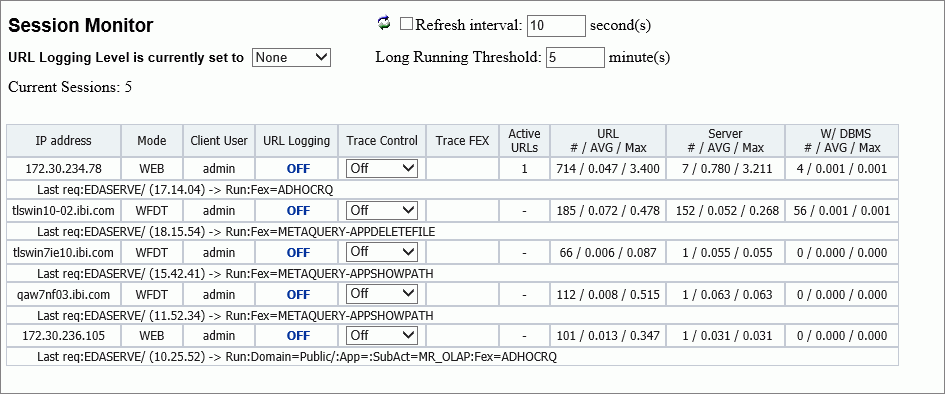
The Session Monitor enables administrators to track all client sessions, as well as connections and activity on the Server. The Session Monitor displays information about connected users, report requests, and Server nodes, as shown in the following image.

Session Monitor main page.

To refresh the information displayed, click the Refresh icon. To set an automatic refresh operation, select the Refresh Interval check box and accept the default setting of ten second intervals, or type the number of seconds you wish to use instead. If you change the value in this field, it will remain valid only while the Session Monitor page is open. If you close this page and return to it later, the default value will be reestablished.

Administrators can enable or disable logging for all current sessions by clicking All/None/Selective next to URL Logging Level is currently set to. To enable or disable logging for individual sessions, click Selective, and then On or Off under the URL Logging column for the individual sessions. By default, all log information is located in the drive:\ibi\WebFOCUS82\logs directory in Windows or the install_directory/ibi/WebFOCUS82/logs in UNIX or Linux.

To prevent inactive sessions from continuing indefinitely, accept the value of five minutes in the Long Running Threshold field, or type a different value to extend or curtail this period. If you change the value in this field, it will remain valid only while the Session Monitor page is open. If you close this page and return to it later, the default value will be reestablished. For each session, the following information is available:

IP Address

The numerical label assigned to the computer or other device that initiated the session.

Using this address, you can identify the user assigned to the computer or other device that initiated the session.

Mode

Identifies the product component that started the session and provides information about all active requests. The product component values are as follows:

WEB

Specifies the Client.

WSRV

Specifies the Server.

WFC

Specifies the Administration Console.

WFRQ

Specifies a report request from a self-service application.

WFDT

Specifies App Studio.

IBFS

Specifies Information Builders File System.

Client User

Specifies the user ID that started the client session. A value of null indicates that it is a request from a self-service application.

URL Logging

Enables or disables logging for an individual session or a current user.

Trace Control

Enables tracing at a specified level of detail, or disables tracing for a specific IP Address, that is, user.

Trace FEX

Identifies whether traces for WFServlet, Client Connector, and Server are enabled for a session. If tracing is enabled, a View Trace icon appears. Click this icon to see the trace.

Active URLs

Specifies the number of URLs that are actively in use during the session. This value is relevant only to sessions that are currently open and active. Each URL represents the workstation from which a request was launched to the application server through the browser.

URL

Specifies the number, average duration, and maximum duration of dynamic URLs sent in HTTP requests. Duration is measured in seconds, calculated to the millisecond. Not all URLs in HTTP requests are forwarded to the server, and not all requests forwarded to the server are then forwarded to the DBMS.

Server

Specifies the number, average duration, and maximum duration of dynamic URLs that run reports on the Server. Duration is measured in seconds, calculated to the millisecond. Not all URLs in HTTP requests are forwarded to the server, and not all requests forwarded to the server are then forwarded to the DBMS.

W/DBMS

Specifies the number, average duration, and maximum duration of dynamic URLs that run reports against an external database. Duration is measured in seconds, calculated to the millisecond. Not all URLs in HTTP requests are forwarded to the server, and not all requests forwarded to the server are then forwarded to the DBMS.

Procedure: How to Export the Session Monitor Log

You may need to export a session monitor log for troubleshooting.

  1. In the Administration Console, click the Diagnostics tab, and then click Session Monitor.

    Current sessions appear in the right pane.

  2. Set the Trace Control option for the chosen session to Details.

    Information icons now appear in the Trace FEX column.

  3. If necessary, run a request for logging, then return to the Administration Console.
  4. Click the View Trace icon .

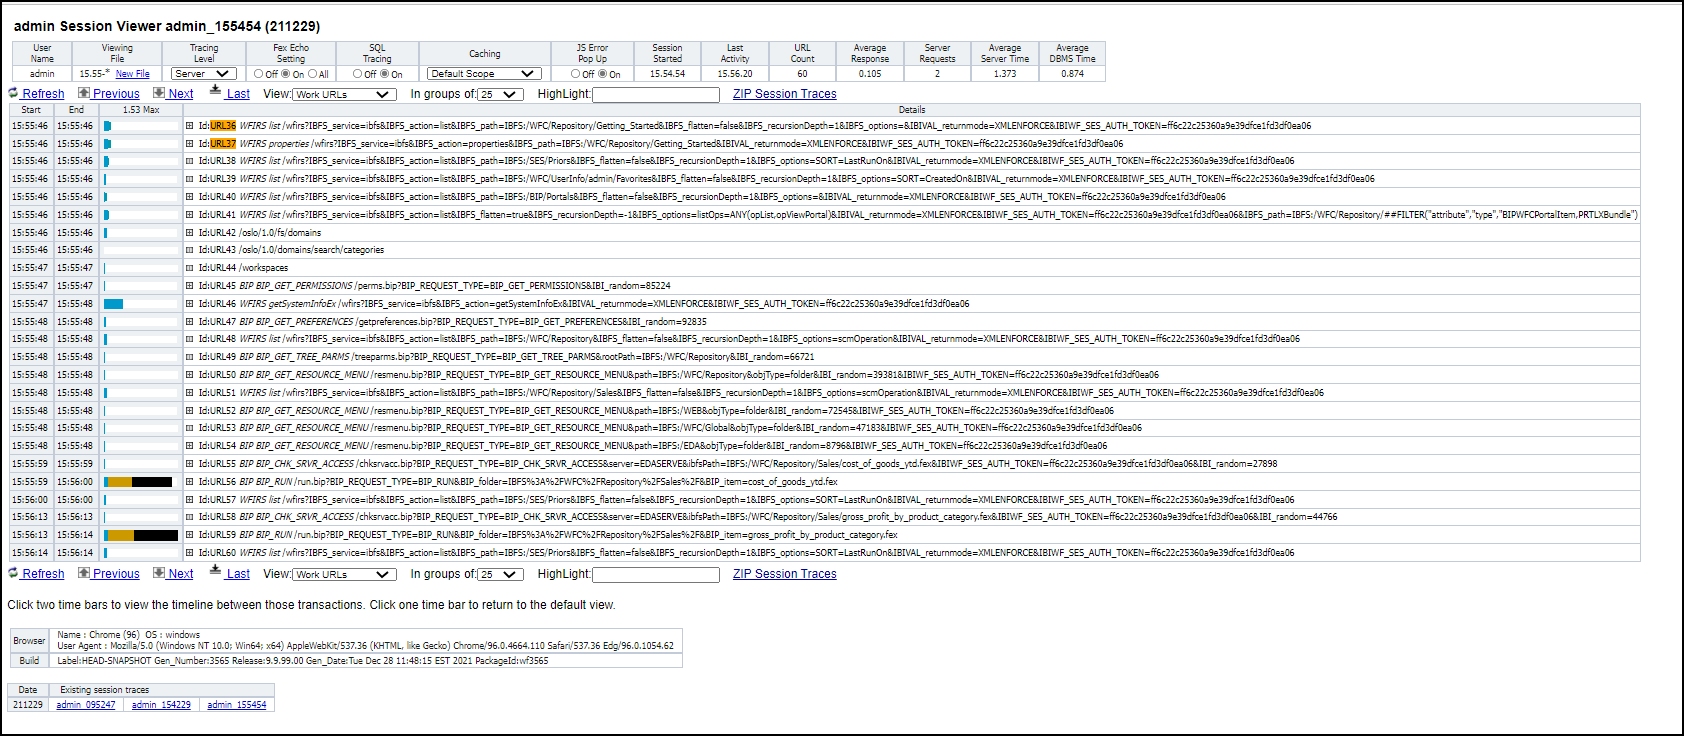
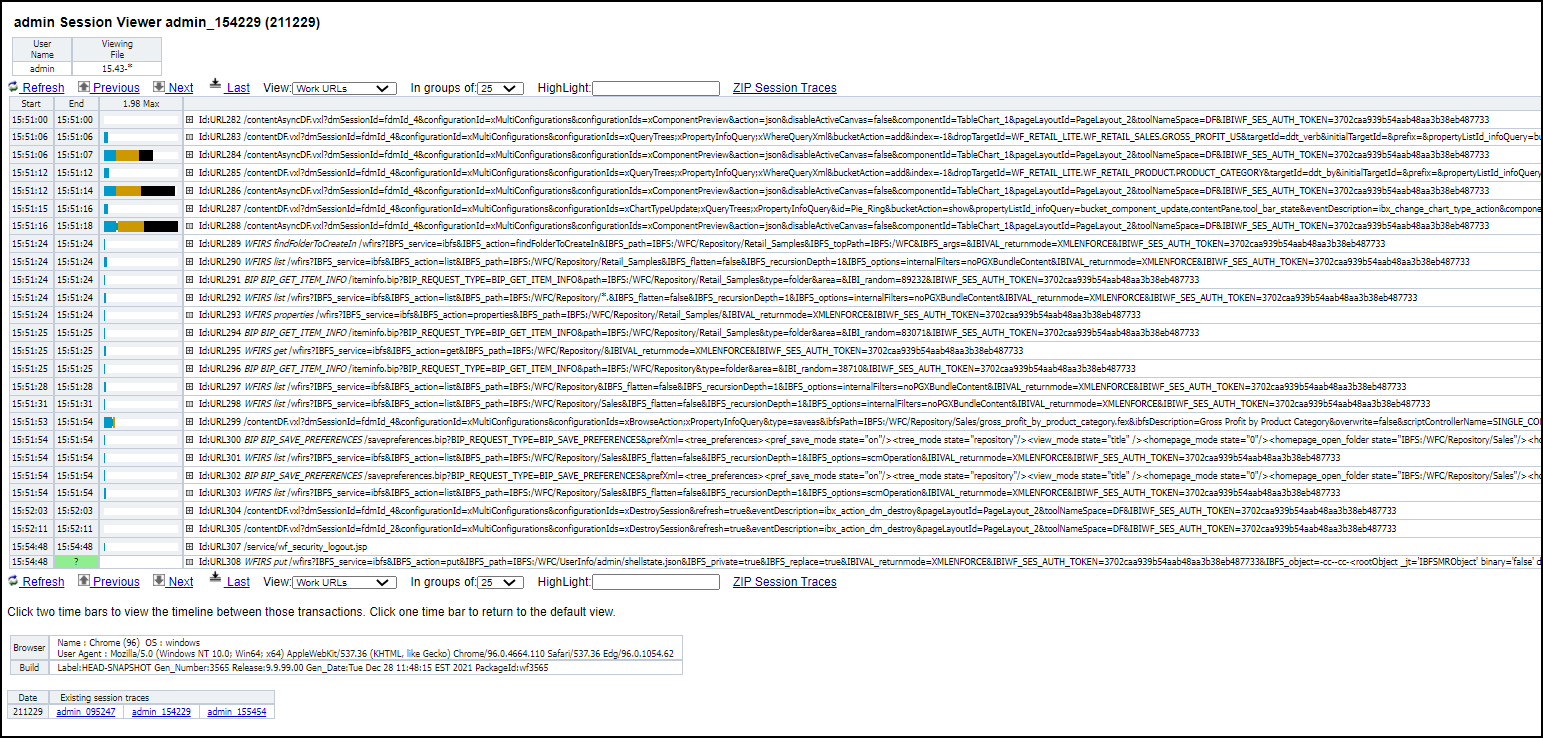
    The Session Viewer appears, as shown in the following image.

    The Session Viewer page opened from the Session Monitor page View Trace icon link.
  5. Click a Zip Session Trace link and save the zip file.
  6. Close the Session Viewer and return to the Session Monitor pane.
  7. Set Trace Control to its previous value. Typically, this is OFF.

    In response, a message above the Session Monitor table confirms that tracing has been changed or stopped.

Viewing Sessions

In this section:

The Session Viewer enables you to review traces of system events that took place during recent work sessions and export them to system administrators or customer support staff. Traces of system events and error messages captured by the Session Viewer provide a clear picture of system operations, and enable you to investigate the causes of system disruptions or performance issues.

The Session Viewer complements the Session Monitor page by extending the range of sessions under review, from those that are currently active, to those that occurred in the past. The parameter Days Until Traces Are Deleted (IBI_TRACE_RETAIN_DAYS) defines the number of days that the Session Viewer retains information about sessions. It also focuses your review by limiting the range of available sessions to those created by you and by those users whose session activities you have permission to review.

You can open the Session Viewer only if you have been assigned the opDevTraces (Development Traces) privilege. This privilege allows you to view traces from your current and previous work sessions. With this privilege, you can open the Session Viewer. To do so, open the Tools menu and select View Sessions. , From the 8207.27 Home Page, select Utilities, and Session Viewer.

If you sign in as an administrator, you can view your sessions and sessions for other users. If you sign in as a different user, you can only view sessions made available to you by the opDevTraces (Development Traces) privilege.

Reviewing the Session Viewer Main Page

The main page of the Session Viewer displays information about your current work session. It also lists entries for all of the recently completed sessions that you have permission to review, as shown in the following image.

The main page of the Session Viewer displaying session traces and links to other sessions.

To open the main page of the Session Viewer, sign in as a user who maintains the opDevTraces (Development Traces) privilege. From the Hub, select Tools and View Sessions. From the WebFOCUS Home Page, select Utilities, and Session Viewer. The session ID follows the format username_HHMMSS (YYMMDD). It contains the username, starting time, and date of the session on display. For each session, the following information is available:

User Name

The name of the user that signed in to this work session.

Viewing File

The name of the Viewing File. File names are identified by their start time and end time in HH.MM format. If an asterisk (*) is displayed as the end time, current traces are being routed to that file.

You can click New File, to capture a new set of traces, which allows users to capture a set of URLs to be reviewed. When you click this link, the Session Viewer automatically creates a new file and assigns all subsequent traces to it. You can review prior traces by clicking a file containing completed traces in the Viewing File list.

Tracing Level

The level of traces captured by the current session. The default value for this field is Off, but you can choose another value from the list. The Session Viewer saves this selection when you close the viewer, and uses it as the default setting for your next session.

The four tracing levels are cumulative, meaning each higher level includes the traces of all of the levels below it. These levels include:

  • Basic. Generates a trace for each URL, which includes IBFS traces and procedure traces.
  • Outputs. Includes Basic level traces and output from URLs that run requests on the Server. This level of tracing affects the amount of disk space required to capture output traces, but does not affect system performance.
  • Debug. Includes Outputs level traces, and log4j debug level written to the Session Viewer output.
  • Details. Includes Debug level traces and legacy WFServlet traces. This level of tracing affects session performance.
  • Server. Includes Details level traces and generates traces for the Server activity for the current work session.
Fex Echo Setting

The level of echo traces captured from the execution of FEX file commands. In a FEX file, the &ECHO variable displays command lines as they execute in order to test and debug procedures. These levels include:

  • Off. Suppresses the display of both stacked commands and Dialogue Manager commands in its traces. This value is the default.
  • On. Displays TIBCO WebFOCUS commands that are expanded and stacked for execution in its traces.
  • All. Displays Dialogue Manager commands and TIBCO WebFOCUS commands that are expanded and stacked for execution in its traces.
SQL Tracing

The level of traces captured from SQL events. These levels include:

  • Off. Suppresses the display of traces of SQL request and response events.
  • On. Displays traces of all SQL request and response events. Even if you select this setting, however, the Session Viewer will not display SQL event traces if there are no requests issued to an SQL database.
Caching

The Caching configuration for the current session. Options in this list override the default caching configuration that is defined on the Application Caches page of the Administration Console Configuration tab, as shown in the following image.

The Session Viewer main page with the Caching list displayed.

The options in this list affect caching operations for the current session only. They enable administrators and developers to temporarily suspend caching for application development sessions.

When the next session starts, the Default Scope option is automatically reassigned to the list. This option resets the cache to a persistent status for the new session, making it ready for use in a production session.

The list contains the following options.

Default Scope

When this option, also known as the User Scope, is selected, data source values remain in the cache and Lru Cache statistics are not cleared when a session ends. This is the default option for the Caching list. It allows cached data and cache statistics to persist from session to session.

This option displays the Default Scope label when it is selected and the Set Default Scope label when it is not selected.

Session Scope

Displays the Session Scope label when it is selected and the Set Session Scope label when cleared.

No Caching

Suspends caching in the current session. After you select this option caching is suspended within the session until you select Set Session Scope or Set Default Scope. This option displays the No Caching label when it is selected and the Turn Off Caching label when cleared.

Refresh Cache

Refreshes the cache and immediately restores the option that was previously selected.

JS Error Popup

Activates the capture of JS Error Popup messages in the session trace. The On option is selected, by default, indicating that JS Error Popup messages are included in the Session Trace.

Session Started

The time that your active session started, in HH.MM.SS format.

Last Activity

The start time of the most recent activity in your active session, in HH.MM.SS format.

URL Count

The total number of URLs issued for the session that you are viewing.

Average Response

The average response time, in seconds, for all URLs issued for the session that you are viewing.

Server Requests

The number of requests made to your Server during your active session.

Average Server Time

The average time (in seconds) that it takes the Server to respond to a request.

Average DBMS Time

The average time (in seconds) that it takes the Server to respond to a request directed to a non-TIBCO WebFOCUS or RDBMS database.

If no current session file is available, the section below the status bar displays the following text:

Session file does not exist.

If a current session file is available, the section below the status bar lists traces for that file.

If you are signed in as an administrator, you can also view a table containing links representing recently completed sessions. If multiple viewable sessions occurred on a specific date, they are listed from left to right in that table in the order in which they occurred, earliest to latest.

Information from completed sessions remains available for the period defined in the setting, Days Until Traces Are Deleted (IBI_TRACE_RETAIN_DAYS).

To view a different session, click a session link on the main page or the session details page. A new page displaying traces for your selected session opens.

Note: The session information links connect to completed sessions only. To view a current session, open the Session Monitor page from the Administration Console, and click an Information icon, if one appears.

Reviewing the Session Details Page

In this section:

To open the session details page, click a session link in the Existing session traces column of the main page. The session details page opens, as shown in the following image:

Session Details Page displaying trace entries from a selected session.

This page displays a group of features that enables you to review relevant details about your selected session, review summary versions of the traces it created, and move on to other sessions.

When the review of your selected session is complete, close the session details page to return to the main page.

When you open the session details page, your sign-in information and the ID of your selected session appear at the top of the screen.

A table underneath the Session ID lists additional details identifying the session under review. The User Name entry identifies the name of the user who initiated the session on display.

The Viewing File entry identifies the range of trace entries on display, as defined by start time. By default, this value displays the entire range of trace entries from the start time to an undefined end time. If a drop-down button appears, you can select a different time range from the drop-down menu.

You can use the following options to change the display of trace information that you want to view.

  • Refresh. Adds any traces to the list that were generated after you opened an active session. This option is not available to previously completed sessions.
  • Previous. Moves the display back to view an earlier set of traces.
  • Next. Moves the display forward to view a later set of traces.
  • Last. Moves the display to view the final set of traces captured right before the end of the session.
  • View. Limits the list of traces by type.
    • All URLs. Displays URLs that return static content, such as .css files, .html files, .js files, and dynamic URLs that perform a Client action, as well as URLs that perform an action on the Server.
    • Work URLs. Limits the display to dynamic URLs, as well as Server requests. This is the default setting.
    • Server Requests. Limits the display to URLs that access the Server.
  • In groups of. Determines the number of trace entries that appear on a single page. You can select 1, 5, 10, 25, 50, 100, or 200. Your selection in this field impacts the use of the Previous, Next, and Last options. The larger the value you select, the fewer times you will be required to move to the previous or next page.
  • HighLight. Assigns a yellow highlight to the start time field of all trace entries that contain the search term that you type in this field.

    For example, if you type the term short, a highlight appears in the Start Time field for any trace entry that contains this term, such as:

    IBFS checkPolicy Success
    IBFS:/EDA/ACTWIN7/ibisamp/short.mas

    Note: To clear the highlights, delete the value from the Highlight field, and then press the Enter key.

  • ZIP Session Traces. Saves all of the traces from the session to a single zip file. When you click this link, you are prompted to open or save the file. Click Save As, browse to a storage location for the zip file, and then click Save.

    The default name for this zip file is the user name, followed by the number of trace and log files it contains. For example, admin_140841.

These options also appear below the trace information table.

Note: If you select two time bars, the page refreshes and displays a timeline between the two transactions they represent, as shown in the following image.

The session details page highlighting the time line between two selected trace entries.

When your review is complete, select one of the two time bars to return to the default view.

The trace information table enables you to review individual session traces in more detail. It displays one summary entry for each trace captured during the session. You can expand these entries to review the detailed event messages captured by the trace.

The table located below the trace information table and options identifies the User Agent and Build that started the session. Details identifying the User Agent include the browser, operating systems, and supporting applications. Details identifying the Build include, the version number, build number, and generation date of the product version to which this session was connected.

A list of recently completed sessions appears at the bottom of the page. This list is a duplicate of the session list on the main page and appears here to enable you to move on to another session without having to leave the session details page.

Reviewing Trace Entries

Each entry in the list of traces on the session details page represents the record for a single system activity, as shown in the following image.

An individual trace entry with Start and End Time and Details.

One activity can include multiple events, and these events become visible when you expand the icon next to a trace to view its full detail.

For each trace, the following information is available:

Start

The time, in hours, minutes, and seconds, that an event in the trace began. Hours are expressed in twenty-four hour time notation.

End

The time, in hours, minutes, and seconds, that an event in the trace ended. Hours are expressed in twenty-four hour time notation.

Number of Seconds Max

The number in the header of this column represents the maximum number of seconds that were required to complete the longest trace in the list.

Entries in this column contain a (time) bar that represents the relative duration of the events in the trace, as shown in the following image.

The number of seconds max section of an individual trace entry with various color sections.
  • The darkest blue section of the bar represents the number of Web CPU seconds that were required to process the events in this trace. It also identifies the trace as containing a Work URL component.
  • The black section of the bar represents the number of Web wait seconds that were required to retrieve a response from a database. It also identifies the trace as containing a Work URL component.
  • The brown section of the bar represents the number of Server seconds that were required to process the events represented in this trace. It also identifies the trace as containing a Server Request component.

You can view tooltips that identify the exact number of seconds that each section of a bar represents by pointing to that section with your mouse. If you are reviewing an active trace in a current session, the bar appears green and occupies the entire column entry. If you hover the mouse over the bar, a tooltip that contains the number of seconds that have already elapsed during that event appears.

Details

The ID of the trace. This is the URL of the destination of the request message that launched the trace events. The first term in the URL identifies the servlet or other application that launched the request. Each trace ID is unique.

When the URL ID number is highlighted in orange, events in the trace associated with it include one or more error messages. Within the detail trace display, events that contain error messages are also highlighted in orange to help you identify when the errors occurred.

Reviewing Expanded URL Details

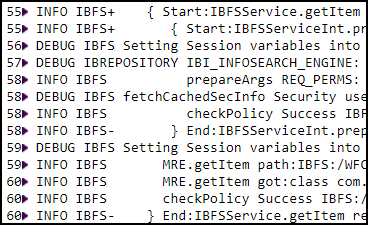
When you expand an individual Trace Details list entry, a nested list of system-generated messages opens. These messages identify the events captured by that trace and the time, in milliseconds, at which those events took place. Events include request and response messages exchanged between the Client and the Server or between the Server and the application server. They also include error messages, informational messages, and system status messages generated by application programs as they execute commands. Entries representing repetitive or subordinate events are nested to help you identify them more quickly, as shown in the following image.

A detail of trace listings showing the I B F S codes at the start of each trace.

A trace entry begins with the event start time and the number of milliseconds after the trace start time at which the event took place. This value helps you distinguish between individual events, and places them in sequence within an individual trace.

The IBFS status code for the trace event follows the event start time.

This column contains one of the following symbols:

Symbol

Description

IBFS+

The starting event of a program or exchange of data between programs or applications.

IBFS-

The ending or final event of a program or exchange of data between programs or applications.

IBFX*

An error message.

IBFSX

An administrative or informational message.

The text of the message generated by the application or program that describes the event appears next. The type of text displayed in this section varies with the type of trace you have selected from the View drop-down list.

  • If you select All URLs or Work URLs, an expanded URL entry displays the status and error messages that were generated as the program ran.

    Note: If your entry includes a Server Request message, the underlined Request ID term of the trace entry links you to full details of the Server Request trace, and the underlined Response ID entry links you to full details of the Server Response trace.

  • If you select Server Request, an expanded URL entry displays the Server Request procedure, followed by a list of status or error messages generated during that procedure. (This is the same display that appears when you open a Server Request link from a Session Monitor Information icon.)

Reviewing Server Request Details

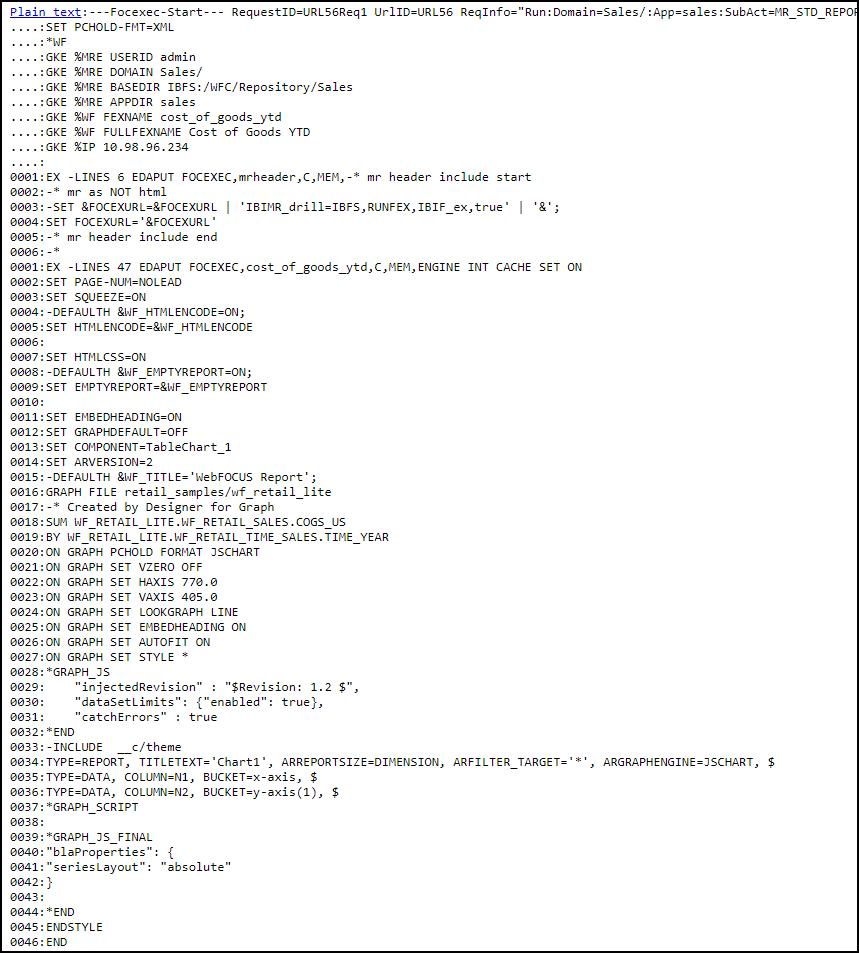
Traces captured from a Server Request identify the details of the query or other request operation sent from the Client to the Server during the session, as shown in the following image.

Reporting Server Request message details including query.

This information identifies the variables and commands sent during the request operation. These requests are usually TABLE requests or -HTMLFORM BEGIN/END requests that are sent from the Client to the Server.

The ID term in the first line above the procedure links it to the URL trace from which it was generated. For example: the ID, URL 101, links the procedure to the server request event line within the activity captured in trace URL 101.

At the end of the list of variables and commands, the procedure displays a list of status messages describing the results of the query or other operation, as shown in the following image.

Reviewing Server Response Details

Traces captured from a Server response identify the information returned in response to a query or other request operation sent from the Server to the Client during a work session.

To view output traces, click on the link from an underlined URL request response entry in a URL Trace entry, such as:

URL103Req4Resp

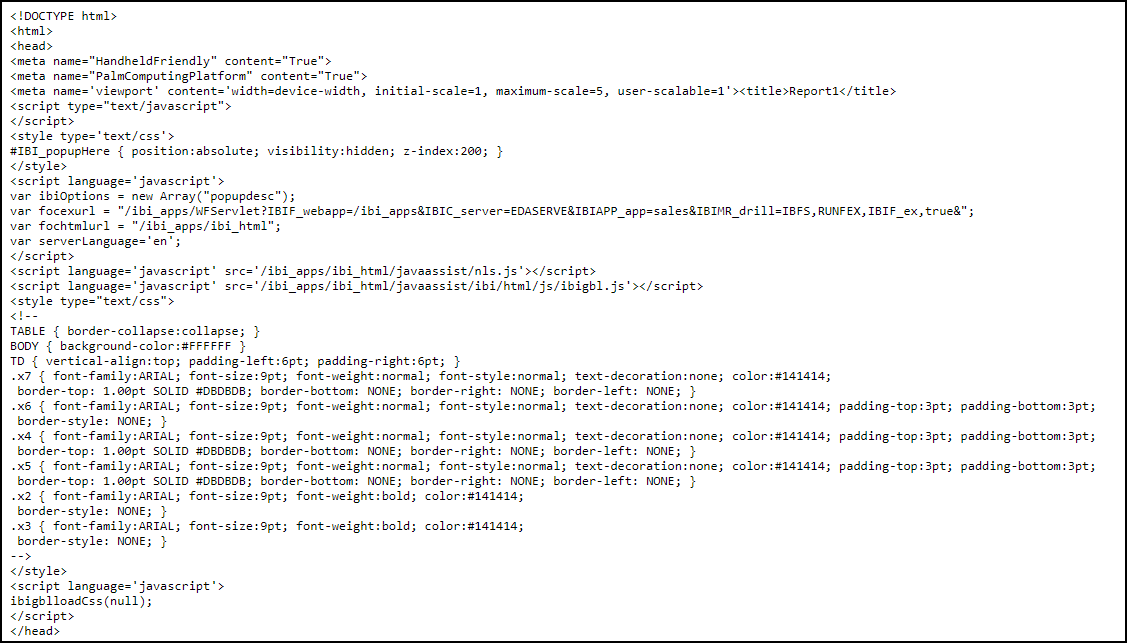
The first part of this display identifies the format variables returned to the Client during the response operation, as shown in the following image.

Output Traces with format variables displayed.

The second part of the display identifies the data returned to the Client during the response operation, as shown in the following image.

Output traces displaying data returned to the Client.

By default, the Session Viewer displays the report itself when you click on the link, URL###Req##Rep. To view the results in HTML format, save the file as a text file, and reopen it. Server responses usually contain data or status messages returned in response to SQL-based queries, updates, or other database-related operations.

Saving Trace Files

In this section:

How to:

The Session Viewer retains trace information in a set of files stored in the traces directory located at drive:\ibi\WebFOCUS_WFI\WebFOCUS\traces in Windows or install_directory/ibi/WebFOCUS_WFI/WebFOCUS/traces in UNIX or Linux, as shown in the following image.

The traces file directory showing the typical hierarchy of the daily trace files folder named with the date in YYMMDD format and a subfolder for an individual session named with the session ID.

Within this directory, there is one daily session activity folder for each day on which user sessions took place within the period defined by the Days Until Traces Are Deleted (IBI_TRACE_RETAIN_DAYS) setting. To make them easily identifiable, these folders use the date on which they were created, in the format YYMMDD, as their title.

Within a daily session activity folder, there is one folder for each session that took place on that day. This folder contains all files created during that session, and the name of the folder is a shortened version of the session ID.

The automated capture and filing of session records makes it easy to find sessions from prior days while keeping your system resources free of excess trace records. The use of a date as the title of the folder containing all sessions for a single day enables the daily sweep for outdated trace files to identify those folders that have exceeded their maximum retention period and are ready to be removed.

If you must save session traces that will not be deleted by this automated sweep, you must create a separate folder within the traces directory and use a name such as save or some other readily identifiable term that does not use the YYMMDD format. You must then capture a zipped copy of the session trace files and save them to this separate folder manually. These files will be available for review until you delete them yourself.

Session Folder Contents

A session folder contains the session.log file and the procedure.log file, along with the .trace file, .dat file, .header file, and .xml file for the URLs that were called during the session.

  • The .traces file contains records of system events captured during the call to or from the URL.
  • The .dat file contains the .html data that defined in the URL call.
  • The .header file contains data included in the header of the message that was a call to or from the URL.
  • The .xml file contains all relevant parameters involved in the call.

The detailed records within these files are described in the previous topics within this section.

Procedure: How to Export Session Viewer Trace Files

Ensure that a folder with a name that does not use the date format YYMMDD has been created in the traces folder, located at drive:\ibi\WebFOCUS_WFI\WebFOCUS\traces for Windows or install_directory/ibi/WebFOCUS_WFI/WebFOCUS/traces for UNIX or Linux. If no such folder appears, create it before implementing this procedure.

  1. Open the Session Viewer.
  2. Select the Zip Session Trace link to save the current session.

    Or

    In the list of sessions beneath the current session table, click the link to a previous session and then click the Zip Session Trace link to save it.

  3. When your browser prompts you to open or save the file, select Save As.
  4. Navigate to the following location for the trace file:
    drive:\ibi\WebFOCUS_WFI\WebFOCUS\traces\undatedfolder\username_time\

    if you are using Windows

    Or

    install_directory/ibi/WebFOCUS_WFI/WebFOCUS/traces/undatedfolder/sessionID

    if you are using Unix or Linux.

    Where:

    undatedfolder

    Is the name of the folder that contains zipped session files that must be retained beyond the number of days specified in the Days Until Traces Are Deleted (IBI_TRACE_RETAIN_DAYS) parameter. This name must not use the date format YYMMDD.

    sessionID

    Is the unique ID assigned to the session. It combines the name of the user who opened the session with the time of day on which the session occurred, separated by an underscore.

  5. Confirm that the zip file was saved in the targeted location and close the Session Viewer.

Working With Log Files

In this section:

The Log Files page displays links to all log files in a single location, where you can review or capture copies of them instantaneously when required to provide records of system events to the Customer Support Team to support troubleshooting or system analysis in response to production issues.

The main grid lists log files, in alphabetical order, by name. Next to each Log Name entry is a list of Logger Names, that is, those pages or events that contribute entries to that log. For example, the audit.log file captures events from com.ibi.uoa, com.ibi.config, com.ibi.content, and others.

Log files contain records of system events. The Log Level field, next to each Logger, identifies the level of events captured by that contributor.

Log levels are cumulative. Events captured by a higher level are included when you select a lower level. For example, if you set the level to WARN, you will capture FATAL level and ERROR level events, as well as events that generate a warning.

The levels are defined below:

For more information about the log and trace files and events they capture see Logging.

The log levels assigned to the audit log files are preset, and are not available for updates. You can adjust the log level assigned to any of the other log files. However, when you recycle the application server, all log levels revert to their default value.

To help you identify problem conditions quickly and easily, log entries for WARN, ERROR, and FATAL events are highlighted as follows:

Color-coded highlights support reviews and troubleshooting by distinguishing log entries of events capturing errors or problem conditions from those capturing routine system events. The use of a consistent color for each of the three event categories helps narrow the search for problem events of a specific level of severity.

Because these highlights are applied by the log file viewer, they appear only when you open and review log files from the Log Files page. Highlights are not saved in zipped copies of the log files, and they do not appear when you open and review log files in a different text editor.

The Zip All button saves copies of all log files and the systeminfo.xml file into a single zip file. You can use this button to capture records of system events and system information whenever necessary.

The Reset All to default button restores the default log levels to all settings that allow you to adjust the logging level.

The log files include records of events from the start of the current day until the time you create the zip file. Event records captured in the log files support troubleshooting and analysis.

The systeminfo.xml file contains a snapshot of the values assigned to system information settings at the time you create the file, including JVM Property Information page values, Application Setting page values, and License Information. The info-date tag at the beginning of the file records the date and time at which the file was created and the values in it were captured.

Note: The Log Files page does not display Web Services traces or client traces. To view these traces, open the Session Viewer or the Session Monitor. For more information about these two features, see Viewing WebFOCUS Sessions or Monitoring WebFOCUS Sessions.

Working With Log Pages

Log pages list detailed records of system events that were captured in a log file in order of the time of their occurrence, from the earliest event on the day of the log to the most recent.

To open a log file for review, click a link from the Log Name column on the Log Files page. The page for your selected log file opens in a separate window.

The name of the log file appears at the top of the page. A list of earlier versions of that log file also appears at the top of the page. This list contains all previous versions of that log file that are currently available in the drive:\ibi\WebFOCUS82\logs directory. The number of days to retain a log file is defined in the setting Days Until Logs Are Deleted (IBI_LOG_RETAIN_DAYS) found on the Application Directories page of the Configuration tab of the Administration Console.

The New trace lines link appears beneath the file name. Click this link to refresh the log page with entries for system events that occur after you open it. New records are posted to a log file automatically. To protect the integrity of this information, no one can use a log page to update or change log file records.

The Bottom link takes you directly to the last entry in the file. This link is useful when you must review a file with a large number of entries, and you want to move directly to the most recent event. Similarly, the Top link, that appears below the last entry, returns you to the first entry in the log file and the features that appear on the top of the page.

The list of individual event entries begins below the Bottom link. Individual entries start with the date and time, in hours, minutes, seconds, and milliseconds, that an event took place. A code name identifying the category of event and the specific event itself follows the date and time. A full description of the event comes next. This description includes any messages generated by the system in response to the event.

You can use the log page to review and search for records of specific events in response to a query from a customer service support team member. The Find command in your browser can help you search for an event by a unique message, event name, or timestamp. You can also scroll through records to locate an event.

When your review is complete, close the log page window. You can use the Save or Print command in your browser to save or print a copy of the log page, or you can capture a zipped copy of it using the Zip All button from the Log Files page.