|
How to: |
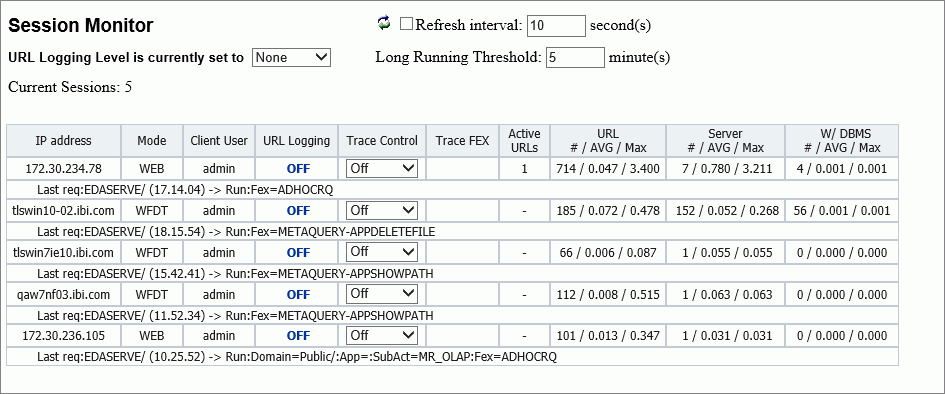
The Session Monitor enables administrators to track all client sessions, as well as connections and activity on the Server. The Session Monitor displays information about connected users, report requests, and Server nodes, as shown in the following image.

To refresh the information displayed, click the Refresh icon. To set an automatic refresh operation, select the Refresh Interval check box and accept the default setting of ten second intervals, or type the number of seconds you wish to use instead. If you change the value in this field, it will remain valid only while the Session Monitor page is open. If you close this page and return to it later, the default value will be reestablished.
Administrators can enable or disable logging for all current sessions by clicking All/None/Selective next to URL Logging Level is currently set to. To enable or disable logging for individual sessions, click Selective, and then On or Off under the URL Logging column for the individual sessions. By default, all log information is located in the drive:\ibi\WebFOCUS82\logs directory in Windows or the install_directory/ibi/WebFOCUS82/logs in UNIX or Linux.
To prevent inactive sessions from continuing indefinitely, accept the value of five minutes in the Long Running Threshold field, or type a different value to extend or curtail this period. If you change the value in this field, it will remain valid only while the Session Monitor page is open. If you close this page and return to it later, the default value will be reestablished. For each session, the following information is available:
- IP Address
-
The numerical label assigned to the computer or other device that initiated the session.
Using this address, you can identify the user assigned to the computer or other device that initiated the session.
- Mode
-
Identifies the product component that started the session and provides information about all active requests. The product component values are as follows:
- WEB
-
Specifies the Client.
- WSRV
-
Specifies the Server.
- WFC
-
Specifies the Administration Console.
- WFRQ
-
Specifies a report request from a self-service application.
- WFDT
-
Specifies App Studio.
- IBFS
-
Specifies Information Builders File System.
- Client User
-
Specifies the user ID that started the client session. A value of null indicates that it is a request from a self-service application.
- URL Logging
-
Enables or disables logging for an individual session or a current user.
- Trace Control
-
Enables tracing at a specified level of detail, or disables tracing for a specific IP Address, that is, user.
- Trace FEX
-
Identifies whether traces for WFServlet, Client Connector, and Server are enabled for a session. If tracing is enabled, a View Trace icon appears. Click this icon to see the trace.
- Active URLs
-
Specifies the number of URLs that are actively in use during the session. This value is relevant only to sessions that are currently open and active. Each URL represents the workstation from which a request was launched to the application server through the browser.
- URL
-
Specifies the number, average duration, and maximum duration of dynamic URLs sent in HTTP requests. Duration is measured in seconds, calculated to the millisecond. Not all URLs in HTTP requests are forwarded to the server, and not all requests forwarded to the server are then forwarded to the DBMS.
- Server
-
Specifies the number, average duration, and maximum duration of dynamic URLs that run reports on the Server. Duration is measured in seconds, calculated to the millisecond. Not all URLs in HTTP requests are forwarded to the server, and not all requests forwarded to the server are then forwarded to the DBMS.
- W/DBMS
-
Specifies the number, average duration, and maximum duration of dynamic URLs that run reports against an external database. Duration is measured in seconds, calculated to the millisecond. Not all URLs in HTTP requests are forwarded to the server, and not all requests forwarded to the server are then forwarded to the DBMS.
