Syntax: How to Build a JSON Line
GIS_LINE(geometry1, geometry2)
where:
- geometry1
-
Alphanumeric or text
Is the first point or line for defining the beginning of the new line.
- geometry2
-
Alphanumeric or text
Is the second point or line for the concatenation of the new line.
Example: Building a JSON Line
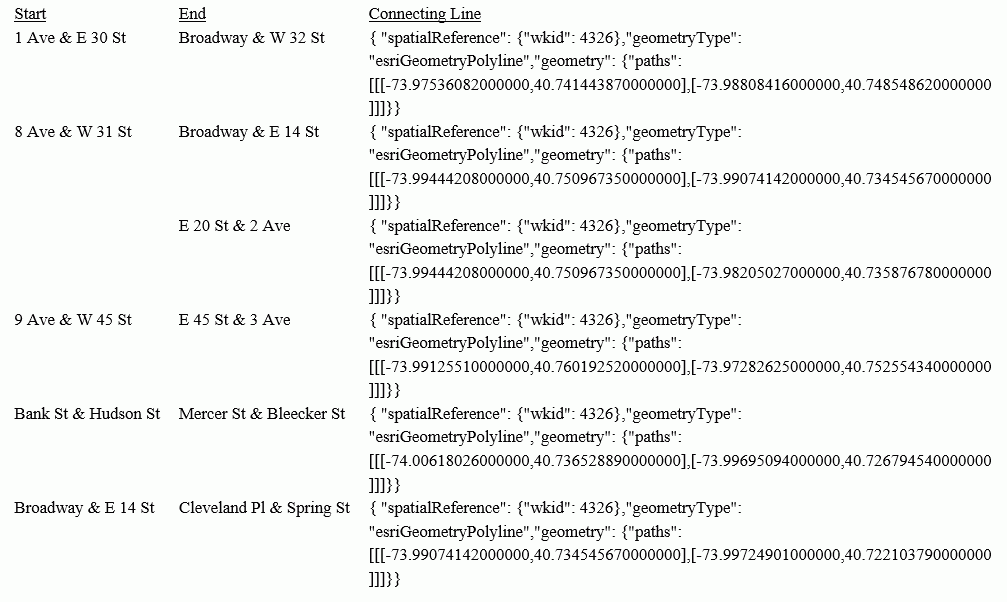
The following request prints start stations and end stations and builds a JSON line between them.
DEFINE FILE ESRI/ESRI-CITIBIKE
STARTPOINT/A200 = GIS_POINT('4326', START_STATION_LONGITUDE, START_STATION_LATITUDE);
ENDPOINT/A200 = GIS_POINT('4326', END_STATION_LONGITUDE, END_STATION_LATITUDE);
CONNECTION_LINE/TX80 (GEOGRAPHIC_ROLE=GEOMETRY_LINE) =
   GIS_LINE(STARTPOINT, ENDPOINT);
END
TABLE FILE ESRI/ESRI-CITIBIKE
PRINT END_STATION_NAME AS End CONNECTION_LINE AS 'Connecting Line'
BY START_STATION_NAME AS Start
WHERE START_STATION_NAME LE 'D'
ON TABLE SET PAGE NOLEAD
ON TABLE SET STYLE *
TYPE=REPORT, GRID=OFF,$
ENDSTYLE
END
The output is shown in the following image.

Example: Charting Geometry Lines
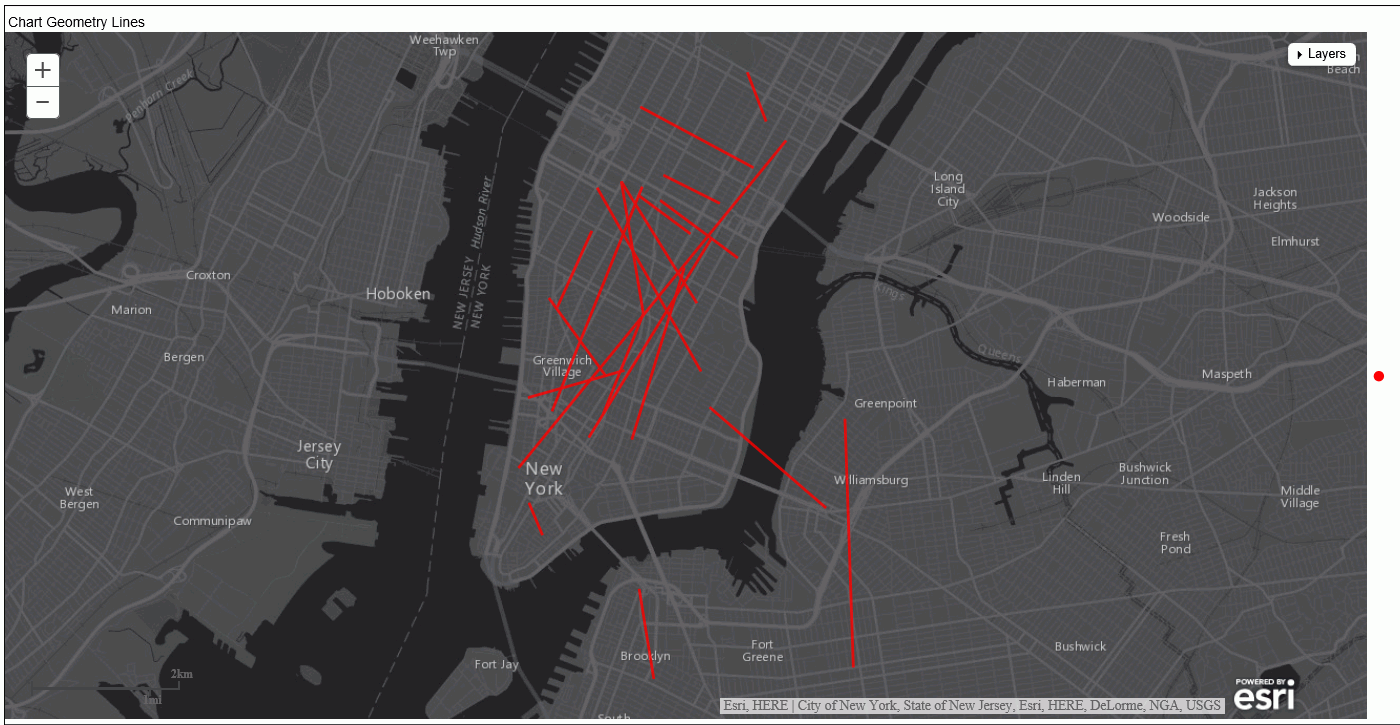
The following request generates geometry lines and charts them on an Esri map.
DEFINE FILE ESRI-CITIBIKE
CONNECTION_LINE/TX80 (GEOGRAPHIC_ROLE=GEOMETRY_LINE) =GIS_LINE(START_STATION_POINT, END_STATION_POINT);
DISTANCE/P33.11 TITLE 'Distance'=GIS_DISTANCE(START_STATION_POINT, END_STATION_POINT);
END
GRAPH FILE ESRI-CITIBIKE
 PRINT
   START_STATION_NAME
   END_STATION_NAME
   DISTANCE
 ON TABLE PCHOLD FORMAT JSCHART
 ON TABLE SET LOOKGRAPH BUBBLEMAP
 ON TABLE SET EMBEDHEADING ON
 ON TABLE SET AUTOFIT ON
 ON TABLE SET STYLE *
  TYPE=REPORT, TITLETEXT='Map', PAGESIZE=E, CHART-LOOK=com.esri.map, $
  TYPE=DATA, COLUMN=N1, /*START_STATION_NAME*/
   BUCKET=tooltip, $
  TYPE=DATA, COLUMN=N2, /*END_STATION_NAME*/
   BUCKET=tooltip, $
  TYPE=DATA, COLUMN=N3, /*DISTANCE*/
   BUCKET=tooltip, $
  *GRAPH_JS_FINAL
"legend": {"visible": true},
"extensions" : { "com.esri.map" :
  { "scalebar" :
{
    "scalebarUnit": "dual",
    "attachTo" : "bottom-left"
  },
  "baseMapInfo": {
       "drawBasemapControl" : false,
       "showArcGISBasemaps" : false,
            "customBaseMaps" : [
            {"ibiBaseLayer" : "dark-gray"}
        ]
   },
  "overlayLayers":
  [{
  "ibiDataLayer": {"map-geometry" :  {"map_by_field" : "CONNECTION_LINE"}}, "title" : "Chart"}]
  },
"introAnimation": "{\"enabled\":false}"
}

  *END
 ENDSTYLE
 HEADING
  "Chart Geometry Lines"
END
The output is shown in the following image.
