Syntax: How to Build a Geometry Point
GIS_POINT(wkid, longitude, latitude)
where:
- wkid
-
Fixed length alphanumeric
Is a spatial reference code (WKID). WKID is an abbreviation for Well-Known ID, which identifies a projected or geographic coordinate system.
- longitude
-
D20.8
Is the longitude for the point.
- latitude
-
D20.8
Is the latitude for the point.
Example: Building a Geometry Point
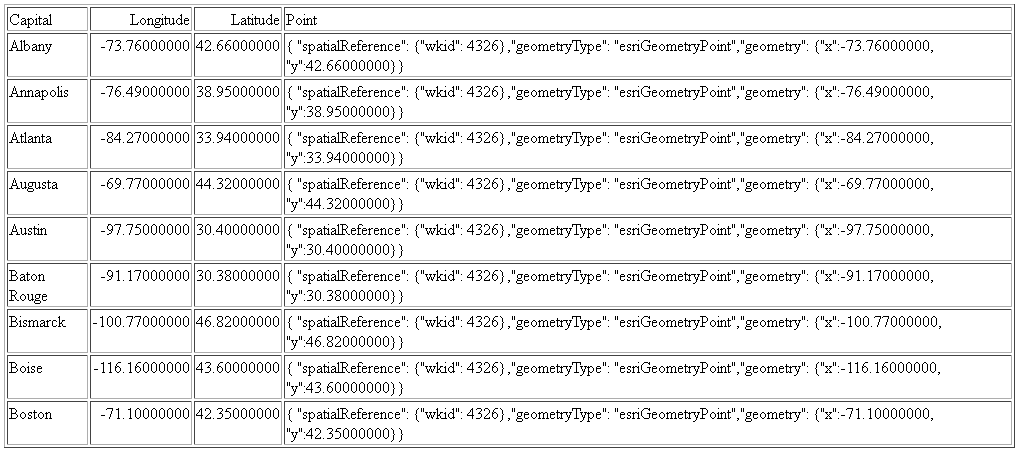
The following request uses the spatial reference code 4326 (decimal degrees) and state capital longitudes and latitudes to build a geometry point.
DEFINE FILE WF_RETAIL_LITE
GPOINT/A200 = GIS_POINT('4326', STATE_PROV_CAPITAL_LONGITUDE, STATE_PROV_CAPITAL_LATITUDE);
END
TABLE FILE WF_RETAIL_LITE
SUM FST.STATE_PROV_CAPITAL_LONGITUDE AS Longitude
FST.STATE_PROV_CAPITAL_LATITUDE AS Latitude
FST.GPOINT AS Point
BY STATE_PROV_CAPITAL_NAME AS Capital
WHERE COUNTRY_NAME EQ 'United States'
WHERE STATE_PROV_CAPITAL_NAME LT 'C'
ON TABLE SET PAGE NOPAGE
END
The output is shown in the following image.

Example: Charting Geometry Points
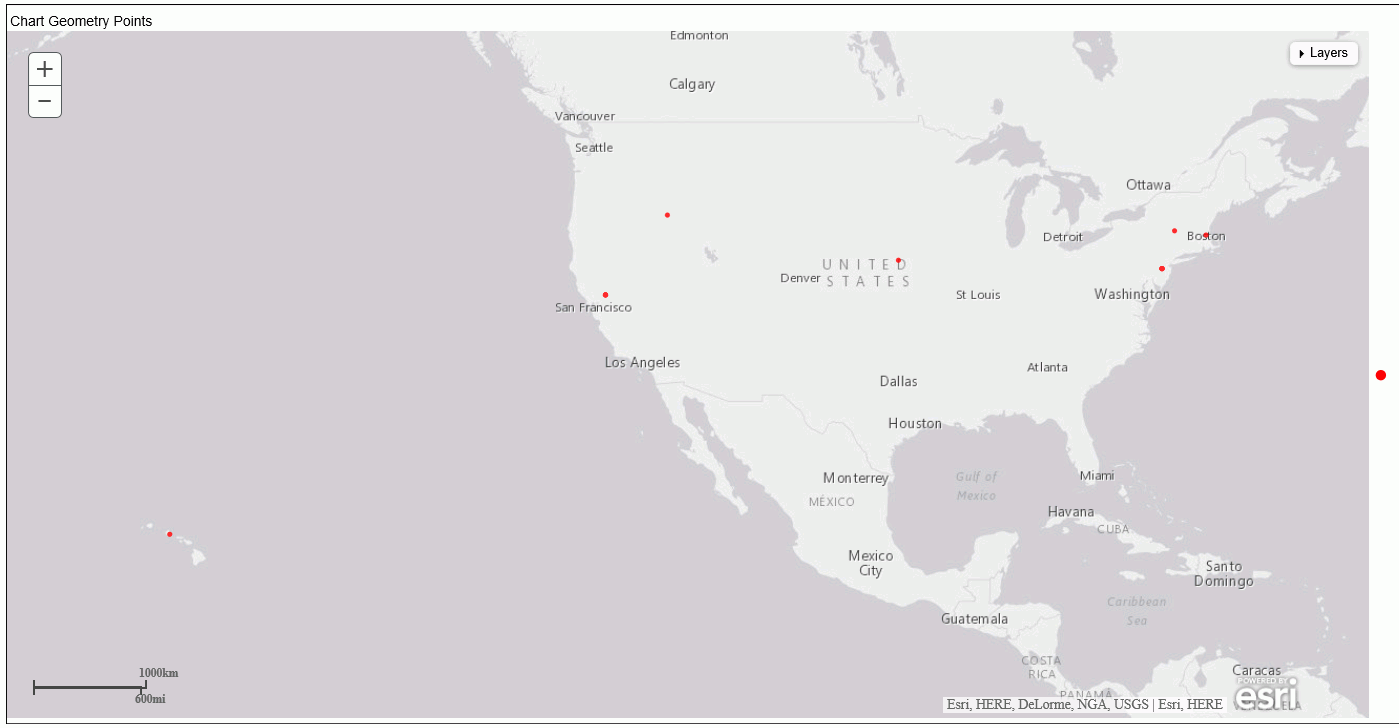
The following request generates geometry points using GIS_POINT charts them on an Esri map.
DEFINE FILE WF_RETAIL
GPOINT/A200 = GIS_POINT('4326', STATE_PROV_CAPITAL_LONGITUDE, STATE_PROV_CAPITAL_LATITUDE);
END
GRAPH FILE WF_RETAIL PRINT STATE_PROV_NAME WHERE STATE_PROV_CAPITAL_LONGITUDE NE MISSING ON TABLE PCHOLD FORMAT JSCHART ON TABLE SET LOOKGRAPH BUBBLEMAP ON TABLE SET EMBEDHEADING ON ON TABLE SET AUTOFIT ON ON TABLE SET STYLE * TYPE=REPORT, TITLETEXT='Map', PAGESIZE=E, CHART-LOOK=com.esri.map, $ TYPE=DATA, COLUMN=N1, BUCKET=tooltip, $
  *GRAPH_JS_FINAL
"bubbleMarker": {"maxSize": "10%"},
"legend": {"visible": true},
"extensions" : { "com.esri.map" :
  { "scalebar" :
{
    "scalebarUnit": "dual",
    "attachTo" : "bottom-left"
  },
  "baseMapInfo": {
       "drawBasemapControl" : false,
       "showArcGISBasemaps" : false,
            "customBaseMaps" : [
            {"ibiBaseLayer" : "gray"}
        ]
   },
  "overlayLayers":
  [{
  "ibiDataLayer": {"map-geometry" :  {"map_by_field" : "GPOINT"}}, "title" : "Report"}]
  },
"introAnimation": "{\"enabled\":false}"
}

  *END
 ENDSTYLE
 HEADING
  "Chart Geometry Points"
END
The output is shown in the following image.
