Creating Reports

In this section:

How to:

You can use the following procedures to create a basic report in the WebFOCUS and InfoAssist.

Procedure: How to Create a Report

After you have signed in to WebFOCUS, you can work with an existing folder, or create a new folder in the WebFOCUS to store your reports.

  1. Open InfoAssist in Report mode.
  2. Drag fields onto the canvas or into the Query pane to begin building your report.

    A basic report is shown in the following image.
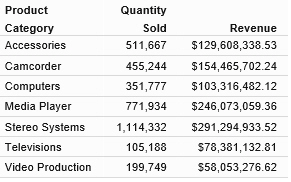
    Basic Report

Procedure: How to Create a Report From the Application Main Menu

  1. In the upper-left corner of the InfoAssist interface, click the IA button to open the Application Main Menu.
  2. From the Application Main Menu, click New.

    The InfoAssist splash screen opens.

  3. On the InfoAssist splash screen, select Build a Report.

    The Open dialog box opens.

  4. From the Open dialog box, select the data source that you want to use, and click Open.

    The data source that you selected appears in the Data pane of the Resources panel.

  5. Drag fields onto the canvas or into the Query pane to begin building your report.

Procedure: How to Create a Report From the Quick Access Toolbar

  1. On the Quick Access Toolbar, click the New icon.

    The InfoAssist splash screen opens.

  2. On the InfoAssist splash screen, select Build a Report.

    The Open dialog box opens.

  3. From the Open dialog box, select the data source that you want to use, and click Open.

    The data source that you selected appears in the Data pane of the Resources panel.

  4. Drag fields onto the canvas or into the Query pane to begin building your report.

Procedure: How to Create a Report From an Existing Chart

  1. Open the chart that contains the data that you want to present in a report.
  2. On the Home tab, in the Format group, click Report.

    The data is presented as a report.

    Note: When creating a report, the SUM or PRINT field containers can support the addition of up to 99 fields. If you add a one-hundredth field, it will automatically replace the last field on the list.

Choosing a Report Output

The following output types are available for reports:

Note: When you create a report in Document mode, you have access to Excel only.

When you create a report in Live Preview or Query Design view, you have access to the following Excel output types:

Note: Additional output types can be enabled in the WebFOCUS Administration Console, including Excel Pivot.

Using Procedure Settings

How to:

Procedure Settings, also known as SET commands, enable you to specify and control items for inclusion in a procedure. If you want to include a Procedure Setting in a procedure (.fex), select the relevant check box to include that setting in the procedure (.fex). Procedure Settings are available in Report, Chart, and Document mode.

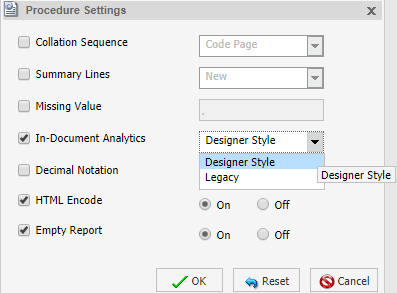
You can access Procedure Settings from the Quick Access toolbar. When you click Procedure Settings, the Procedure Settings dialog box displays, allowing you to select the options to apply to your procedure, as shown in the following image.

Options include:

Note: In Report mode, all settings apply. In Chart mode, only Collation Sequence (COLLATION), Decimal Notation (CDN), and Empty Report (EMPTYREPORT) settings are applicable. In Document mode, Procedure Settings apply to the whole document. These settings are currently unavailable in Visualization mode.

Procedure: How to Create a Procedure Using the Missing Value Option

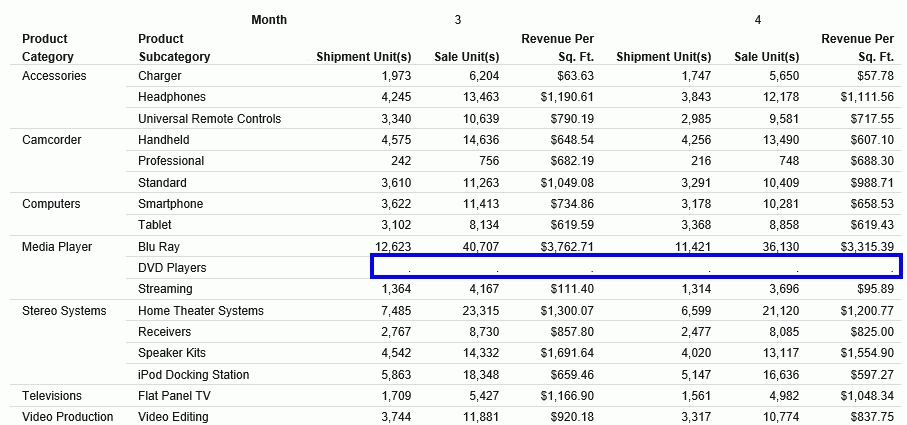
  1. Create a report with a dimension, a measure, and an across sort field that shows missing values, as shown in the following image.

    Note: The highlighted area indicates the default ( . ) for missing values.

  2. On the Quick Access toolbar, click Procedure Settings.
  3. Click the Missing Value check box.
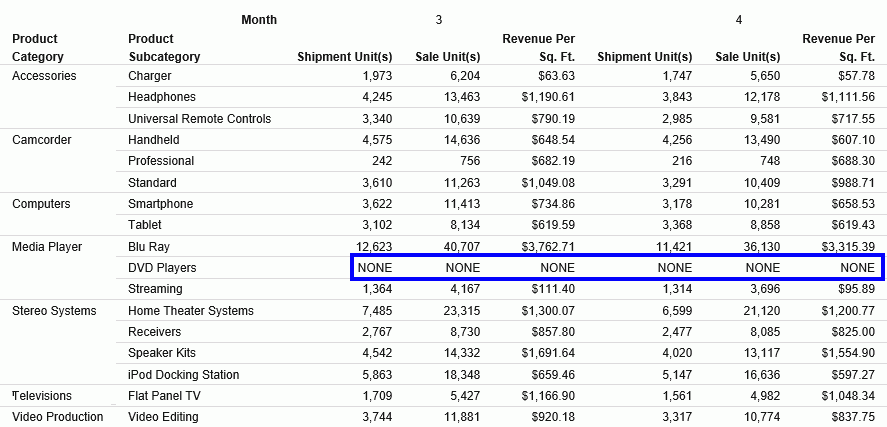
  4. In the Missing Value text box, enter the characters to be used to represent missing values in your report. For example, NONE.

    Note: By default, this is set to ( . ). However, common examples include N/A or NONE.

  5. Click OK.
    Fields with missing values are indicated by the word NONE, in this case, as that is what was specified. This value is shown in the following image.
  6. Save the procedure.

Procedure: How to Create a Procedure Using the Empty Report Option

  1. Create a report with one or more measures and two dimensions.
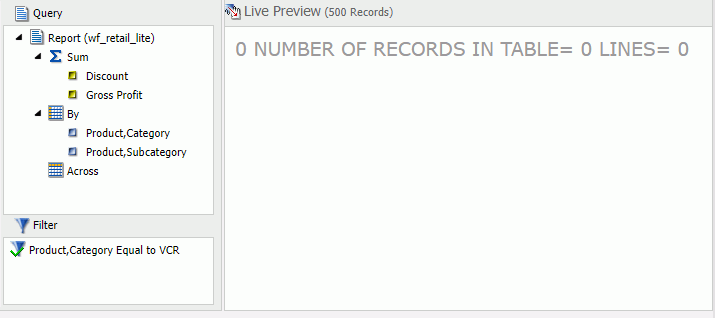
  2. Add a filter to create an empty report by filtering on a value that does not exist in the dimension that you select.

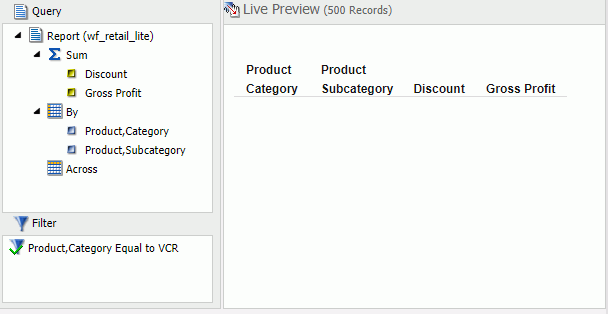
    Note: The addition of a filter condition causes your report to have no records, and the default behavior (EMPTYREPORT=ON) displays the heading and column titles.

    The following image shows an empty report.

  3. On the Quick Access toolbar, click Procedure Settings.
  4. Clear the Empty Report check box.

    Note: This option is selected, by default. Notice that Empty Report can be set to On or Off. When enabled and set to On, the shell of the report (headings and titles) will be displayed. If the setting is turned off, the environment default will be used.

  5. Click OK.

    When the Empty Report check box is cleared, no report is generated, as shown in the following image.
  6. Save the procedure.

Creating Thumbnails for Use With the WebFOCUS

How to:

In InfoAssist, you can create and store thumbnail images for use in the WebFOCUS . Thumbnail images allow you to see a snapshot of a report or chart without opening the file. In InfoAssist, you can create a thumbnail image by clicking on the Create Thumbnail icon, which is located on the Quick Access toolbar.

You can create thumbnail images when working in Report and Chart mode in InfoAssist. These images are smaller renditions (220x160px) of your actual report or chart as it displays in Live Preview. Once you create the thumbnail and save the report or chart, you can access the thumbnail image from the file list on the WebFOCUS , as shown in the following image.
Note: Thumbnail images are stored as part of the procedure when it is saved in the repository.

Procedure: How to Create a Thumbnail Image of a Report or Chart

  1. Open InfoAssist in Report or Chart mode.
  2. Create a report or chart.
  3. On the Quick Access Toolbar, click Create Thumbnail, as shown outlined in blue in the following image.

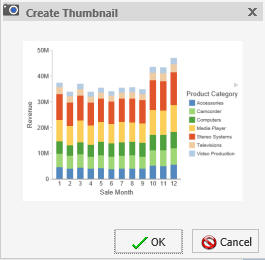
    The Create Thumbnail dialog box displays, as shown in the following image.

  4. On the Create Thumbnail dialog box, click OK.
  5. On the Message dialog box, a message displays stating that the Thumbnail has been created. Click OK.
  6. On the Quick Access Toolbar, click Save to save the chart or report along with the thumbnail. The thumbnail is stored with the procedure.

Procedure: How to View the Properties of a Thumbnail from the WebFOCUS

  1. Create a report or chart that contains a thumbnail.
  2. Save the procedure.
  3. In the Items list on the WebFOCUS , locate the procedure.
    The image that displays is the thumbnail that was saved with the procedure.
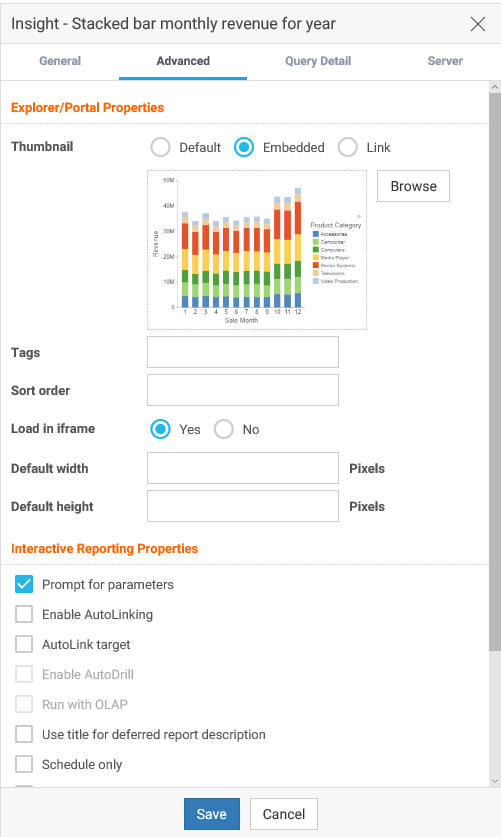
  4. Right-click the procedure and select Properties to view additional thumbnail options.
  5. Click the Advanced tab.
    The thumbnail displays in the Explorer/Portal Properties section of the panel, as shown in the following image.