|
How to: |
Auto Drill enables you to navigate through different levels within the dimension hierarchy of your data source. This allows you to review underlying data for a particular area, and move through the structure of your data source based on your informational needs.
In order to use Auto Drill, you must enable it by clicking the Auto Drill button on the Format tab, in the Run with group.
Once you have enabled Auto Drill, you can develop your report or chart and run it to activate the hyperlinks that Auto Drill creates. This enables you to navigate up or down through the related hierarchy of your data source by clicking the links that display.
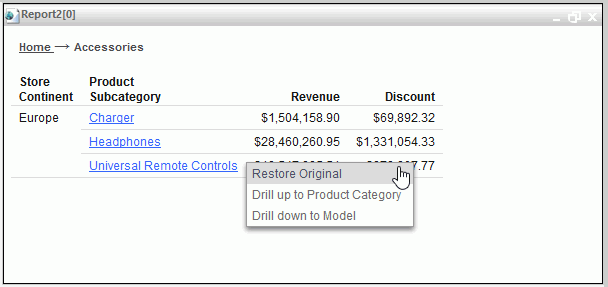
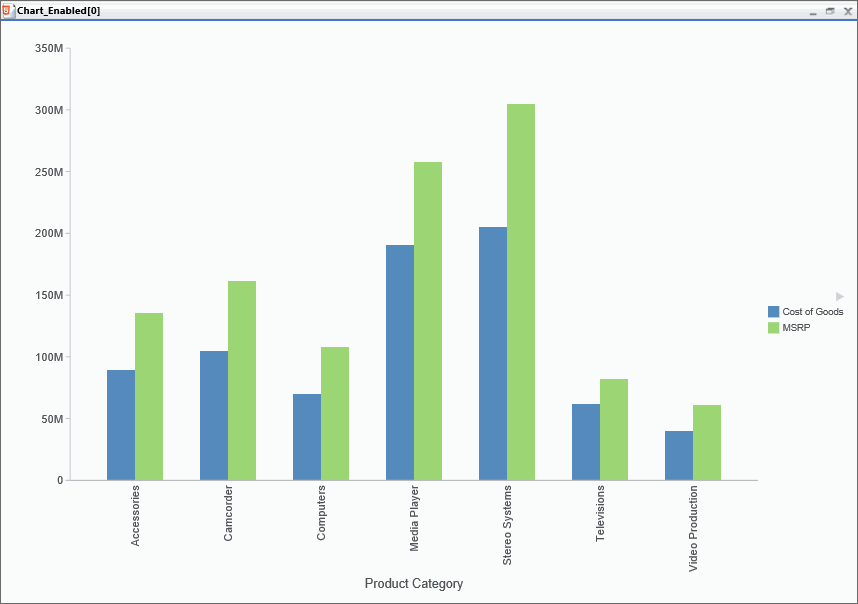
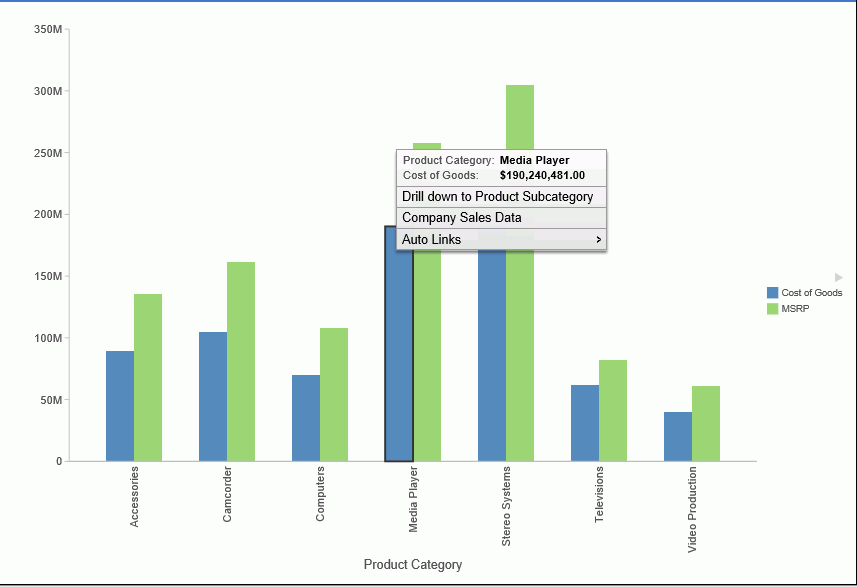
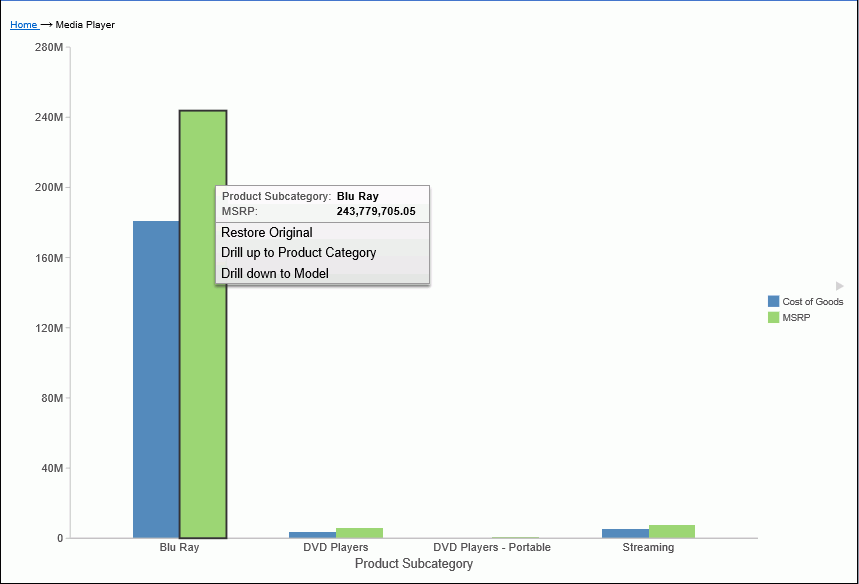
When you click a hyperlink, the option to drill up or drill down displays, depending on where you are in the hierarchy of your data. You can then select one of these options to begin navigating your data. For example, if you have Product Category in your hierarchy, you would be able to drill down to Product SubCategory. When you drill down, you can subsequently drill back up to the originating dimension sort field. If you have selected a data source that has multiple levels and your report or chart uses a component in the middle of the hierarchy, both the Drill up and Drill down options will display. Once you have started navigating your data using the Drill up and Drill down options, the Restore Original option displays, enabling you to start your data analysis over by re-executing the original Auto Drill request.
The drill up and drill down options are shown in the following image.

At run-time, the Auto Drill functionality displays a breadcrumb header. This defines your current location in the hierarchy of your data source and enables you to navigate back and forth between different levels in your data.
- The Auto Drill functionality is only available for data sources that have a dimension hierarchy.
- If you have Auto Drill enabled and you attempt to run your report or chart in deferred mode, the hyperlinks will not display. This is also true for Auto Drill enabled reports that are distributed through ReportCaster.
- With the exception of Visualization mode, Auto Drill is available at run-time, but not in Live Preview.
- Auto Drill is supported for HTML and
- Auto Drill is automatically enabled in Visualization mode for data sources that have a dimension hierarchy.
- Auto Drill is not supported for all HTML output format charts, or for HTML5 output format charts that do not support the new chart attributes syntax.
- Auto Drill is not supported on Across fields in reports.
- You must use dimension fields as a sorting field, either BY or ACROSS.
- If you are creating a chart that has multiple dimension sort fields in the request and some of these belong to the same dimension hierarchy, you may encounter multiple links with the same label in the drill menu.
- When working in Document mode, Auto Drill is unavailable.
- Auto Drill functionality is not available in reports distributed by ReportCaster, because Auto Drill uses live data, in an interactive session, for data drilling. Data values and totals may not be the same if the data has changed since the last distribution. Mixing past data with current data could impact data analysis.
- When Auto Drill is enabled, Accessibility is disabled. When Accessibility is enabled, Auto Drill is disabled. In Chart mode, Accessibility is disabled, by default.
- Auto Drill is not supported with Save Parameters reports.


