Enabling Additional Output Types
|
In this section: |
The output types of PNG, GIF, JPEG, and SVG do not appear on the status bar, in the Output Types menu, by default. In addition, User Selection is not available, by default. You can enable these options by opening the Administration Console, selecting Utilities, and then InfoAssist Properties.
If these formats are not enabled and you try to open an existing procedure with PNG, then HTML becomes the output. In addition, the following warning messages could open:
- When opening an existing procedure with JPEG, GIF, or SVG, a warning message opens, indicating that the request is not allowed with the current configuration and that the procedure will be converted to HTML output.
- When opening an existing procedure with PDF or GIF, a warning message opens, stating that the request is not allowed with the current configuration and that the procedure will be converted to PDF output.
When you run a report, the output is created in the format that is currently selected. You can also set output format options from the output format button in the status bar.
User Selection
The User Selection output format allows you to change the output type of your report at run time. User Selection can be accessed on the status bar, in the Output Types menu.
Note: User Selection must be enabled in the Administration Console in order to access the functionality.
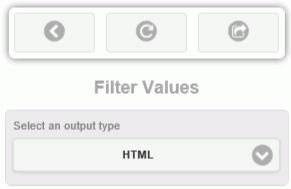
Once it is enabled, you are prompted, at run time, to select an output type. This is shown in the following image.

You can select one of the following output types for your report, chart, or document:
- For reports, you can select HTML, , PDF, , Excel (xlsx), Excel Formula (xlsx), and PowerPoint (pptx).
- For charts, you can select HTML, HTML5, , PDF, , Excel (xlsx),
and PowerPoint (pptx).
Note: When working with charts that do not employ the new chart attribute syntax, all output formats will display when User Selection is selected. If you are working with a chart that uses the new chart attribute syntax, HTML5 and are the only output formats available for selection. Exceptions to this rule are the HTML5 specific charts that do not use the new attribute syntax, but are only available in HTML5 or formats, including: Tagcloud, Parabox, Mekko, and Streamgraph.
- For documents, you can select HTML, , PDF, , Excel (xlsx), and PowerPoint (pptx).