|
How to: |
Auto Drill enables you to navigate through different levels within the dimension hierarchy of your data source. This allows you to review underlying data for a particular area, and move through the structure of your data source, based on your informational needs.
Auto Drill can be enabled for stand-alone content items. If you convert a chart or report with Auto Drill to a page with new content, a warning appears, alerting you that Auto Drill functionality will not be carried over. Auto Drill is functional in content added externally to an assembled page. To enable Auto Drill, in the Content section of the Settings tab, on the Properties panel, select AutoDrill. Auto Drill is not available if your chart or report does not contain fields that are part of a hierarchy.
Once you have enabled Auto Drill, you can develop your report or chart and run it to activate the hyperlinks that Auto Drill creates. This enables you to navigate up or down through the related hierarchy of your data source by clicking the links that display.
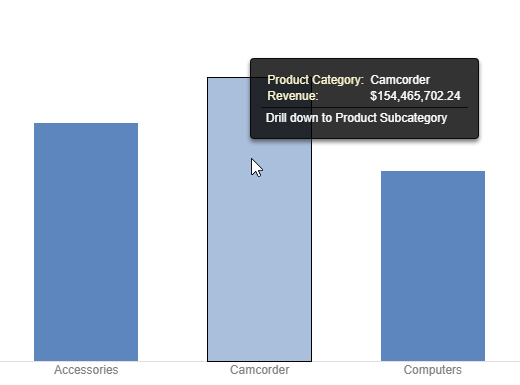
In a chart, Auto Drill links are available from the tooltip that appears when you point to a section of a chart, as shown in the following image.
In a report, Auto Drill links are available when you click a data value hyperlink. The values are styled as hyperlinks to indicate that you can drill into them, as shown in the following image.
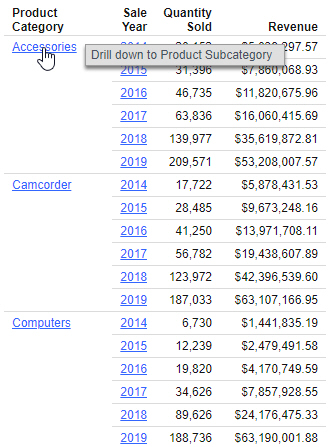
When you click a hyperlink, the option to drill up or drill down displays, depending on where you are in the hierarchy of your data. You can then select one of these options to begin navigating your data. For example, if you have Product,Category in your hierarchy, you would be able to drill down to Product,Subcategory. When you drill down, you can subsequently drill back up to the originating dimension sort field. If you have selected a data source that has multiple levels and your report or chart uses a component in the middle of the hierarchy, both the Drill up and Drill down options will display. Once you have started navigating your data using the Drill up and Drill down options, the Restore Original option displays, enabling you to start your data analysis over by re-executing the original Auto Drill request.
The drill up and drill down options are shown in the following image.
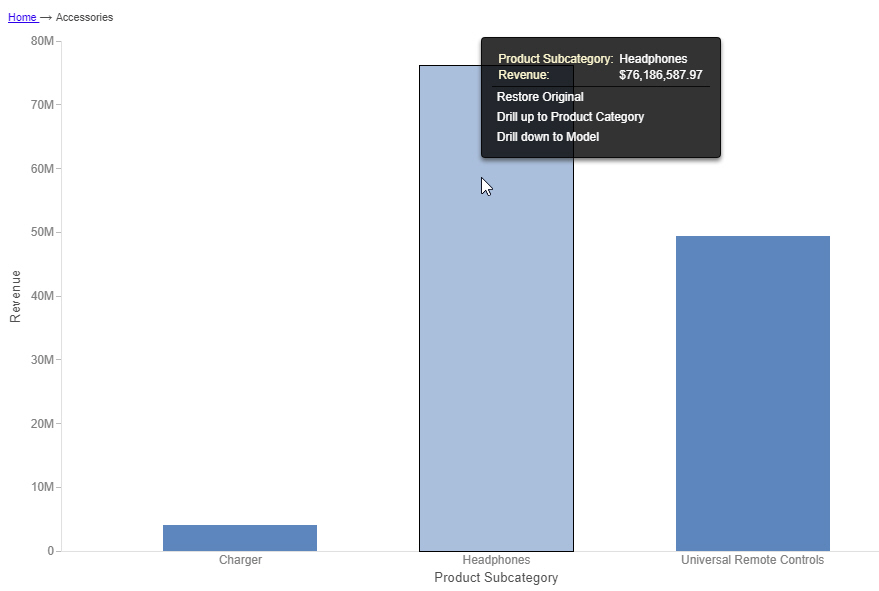
At run-time, the Auto Drill functionality displays a breadcrumb header. This defines your current location in the hierarchy of your data source and enables you to navigate back and forth between different levels in your data.
When you drill into a report, the result is filtered based on the selected value, and on the related values of any higher level sort fields. All applicable values for lower level fields are shown. Since charts do not have explicit field hierarchies, you can determine how filtering is applied when using Auto Drill in a chart with multiple dimensions, by selecting different options from the run-time menu.
When Auto Drill is enabled for a chart with multiple dimension fields, such as if there is one dimension field in the Horizontal bucket and another in the Color bucket, you can choose whether to apply filters as part of the Auto Drill navigation, based on the run-time option that you select. If you choose to apply filters, then when you drill down into a field hierarchy using Auto Drill, the result drills into the area of the chart that you clicked, and is filtered based on all dimension field values pertinent to that area. If you choose not to apply filters, the dimension that you drill into is replaced with the next field in the hierarchy, filtered for the value of the selected Auto Drill link, and other fields are not filtered. The chart continues to show all applicable values for other dimension fields.
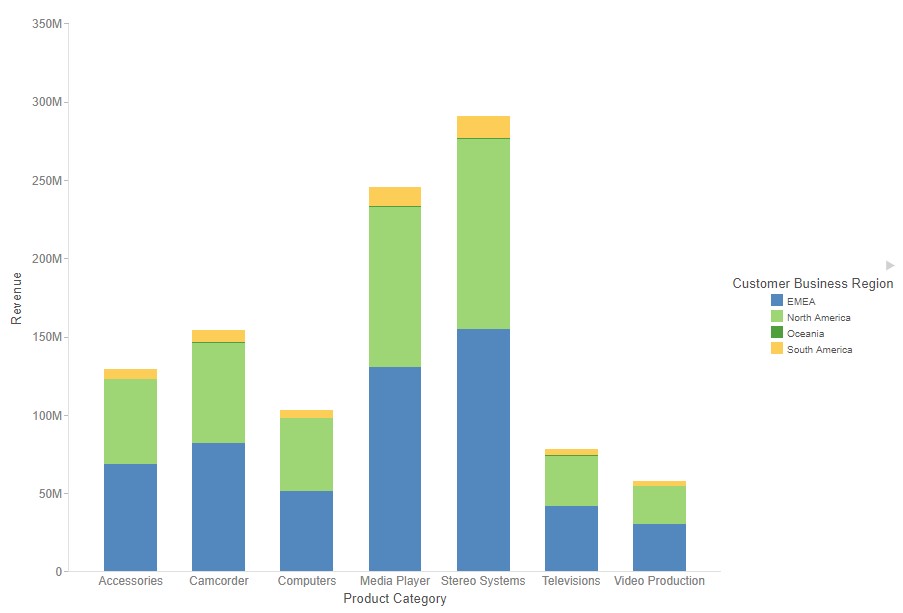
For example, the following image shows a stacked bar chart with the Product Category field in the Horizontal bucket, and the Customer Business Region field in the Color bucket.
When you run the chart and point to a segment of it, the tooltip shows options to use Auto Drill with or without filters, as shown in the following image.
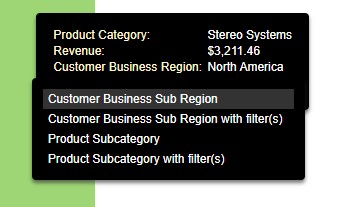
When you use Auto Drill to drill into the Product Category field from a segment in the Accessories riser, and choose not to apply filters, the resulting chart shows subcategories within Accessories, for all Business Regions, as shown in the following image.

If you drill into Product Category from a segment in the Accessories riser and do apply filters, then the resulting chart only shows the Business Region of the segment that you drilled into, as shown in the following image.

- The Auto Drill functionality is only available for data sources that have a dimension hierarchy. Dimension hierarchies are a capability of Business View Plus, and also of legacy Dimension View and Real Cube metadata.
- If you have Auto Drill enabled and you attempt to run your chart in deferred mode, the hyperlinks will not display. This is also true for Auto Drill enabled reports that are distributed through ReportCaster.
- Auto Drill is not supported for all HTML output format charts, or for HTML5 output format charts that do not support the new chart attributes syntax.
- You must use dimension fields as a sorting field, either BY or ACROSS.
- If you are creating a chart that has multiple dimension sort fields in the request and some of these belong to the same dimension hierarchy, you may encounter multiple links with the same label in the drill menu.
- Auto Drill functionality is not available in reports distributed by ReportCaster, because Auto Drill uses live data, in an interactive session, for data drilling. Data values and totals may not be the same if the data has changed since the last distribution. Mixing past data with current data could impact data analysis.
- When Auto Drill is enabled, Accessibility is disabled. When Accessibility is enabled, Auto Drill is disabled. In Chart mode, Accessibility is disabled, by default.