Procedure: How to Create HOLD Files in TIBCO WebFOCUS Designer
You can use WebFOCUS Designer to create and save HOLD files to be used immediately within your current visualization or saved as new data sources for future reports and visualizations.
- From the Hub page, click the plus menu.
- Click Create Visualizations.
The Select Data Source dialog box opens.
- Select a data source.
- Click Prepare/Extract Data.
Note: You can click Create Visualization to display your data in WebFOCUS Designer's Visualization tab. Then click the Data tab to prepare or extract data.
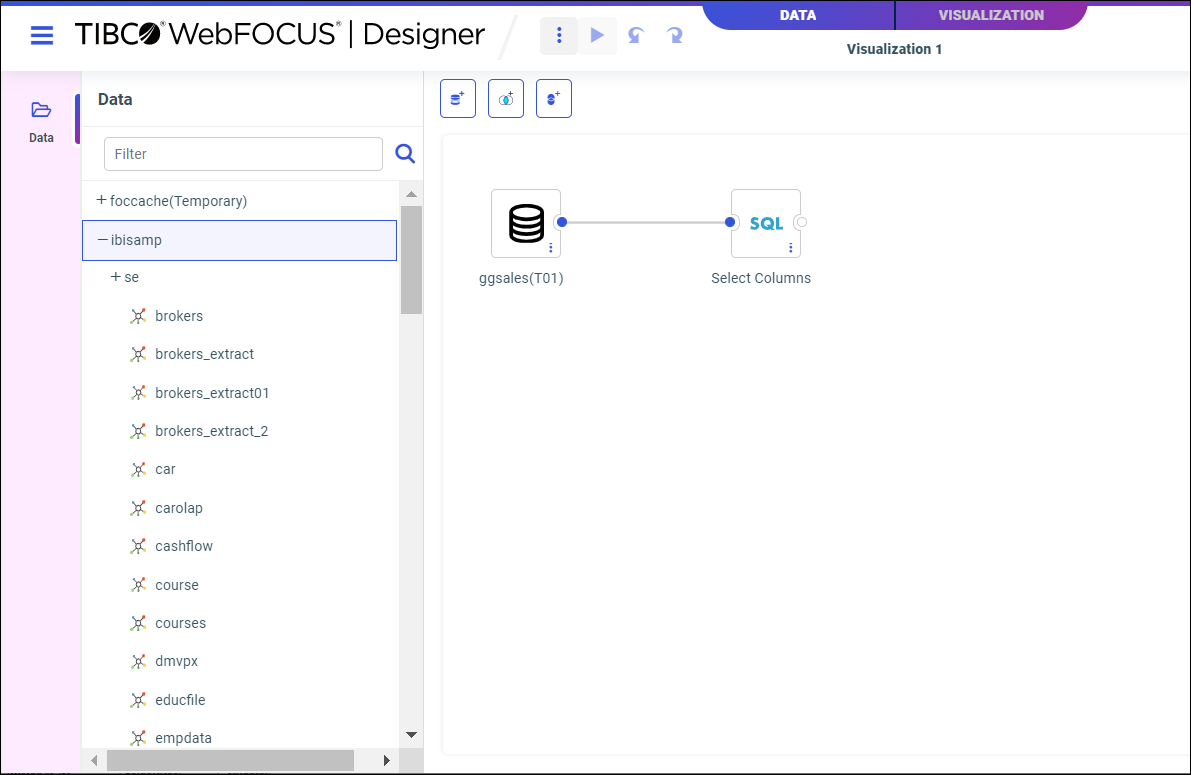
Your data flow displays on the Data tab canvas, as shown in the following image.
- Add an additional data source to the flow.
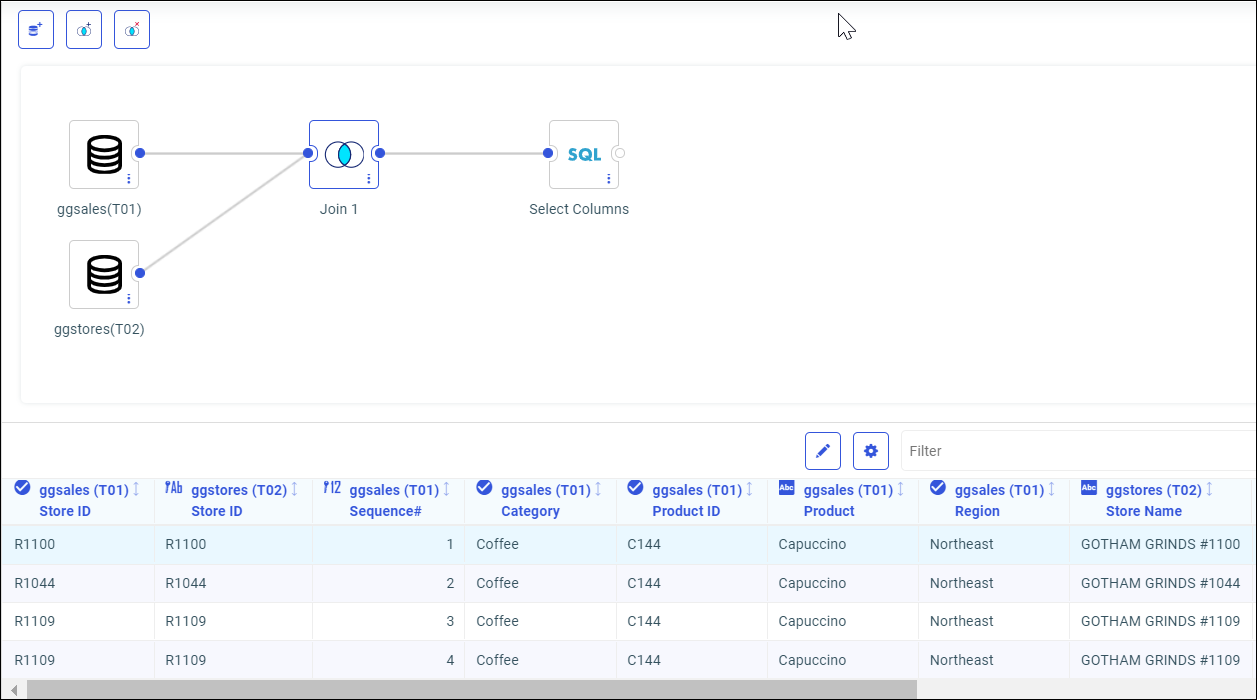
For example, to create a Join, drag another data source from the Applications tree on top of your original data source on the canvas. The resulting Join is shown in the following image.
For more information on Joins, see Joining Data.
- Right-click on the Select Columns node.
- Select Edit.
The Select Editor dialog box opens, as shown in the following image.
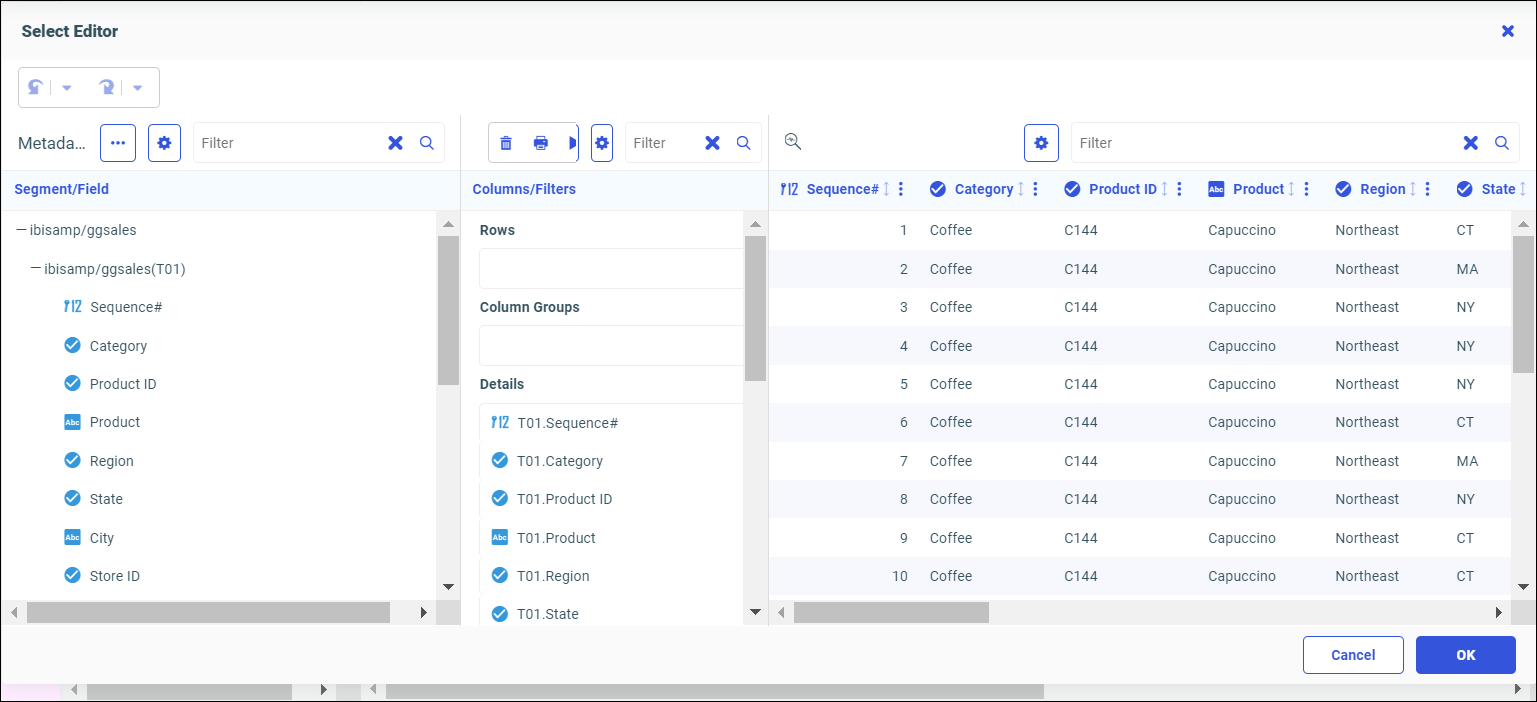
- Edit your data as needed.
- Click OK.
- Right-click on the Select Columns node.
- Select Stage Permanent Extract (Target).
The Stage Permanent Extract dialog box opens, as shown in the following image.
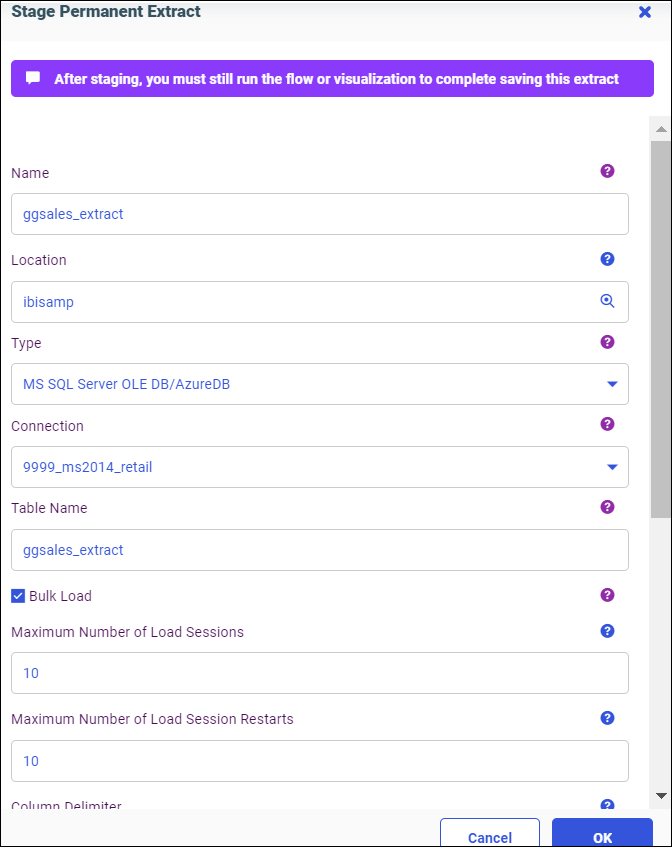
You can select the properties of your HOLD file, including the application directory for storage, the name of the extract, and the file type of the extract.
HOLD files can be saved permanently for future and repeated use, or saved temporarily for current use. This gives you the flexibility to use and store HOLD files as needed, based on how you want to use the files that you create. If you select Create Session Extract, the HOLD file will be saved temporarily to the foccache directory, and will be useable for the current session only. For any saved visualization specifying a HOLD file extract, the HOLD file will be recreated any time that visualization is executed.
- Click OK.
Your changes have been made, and your staged extract displays in the flow, as shown in the following image.
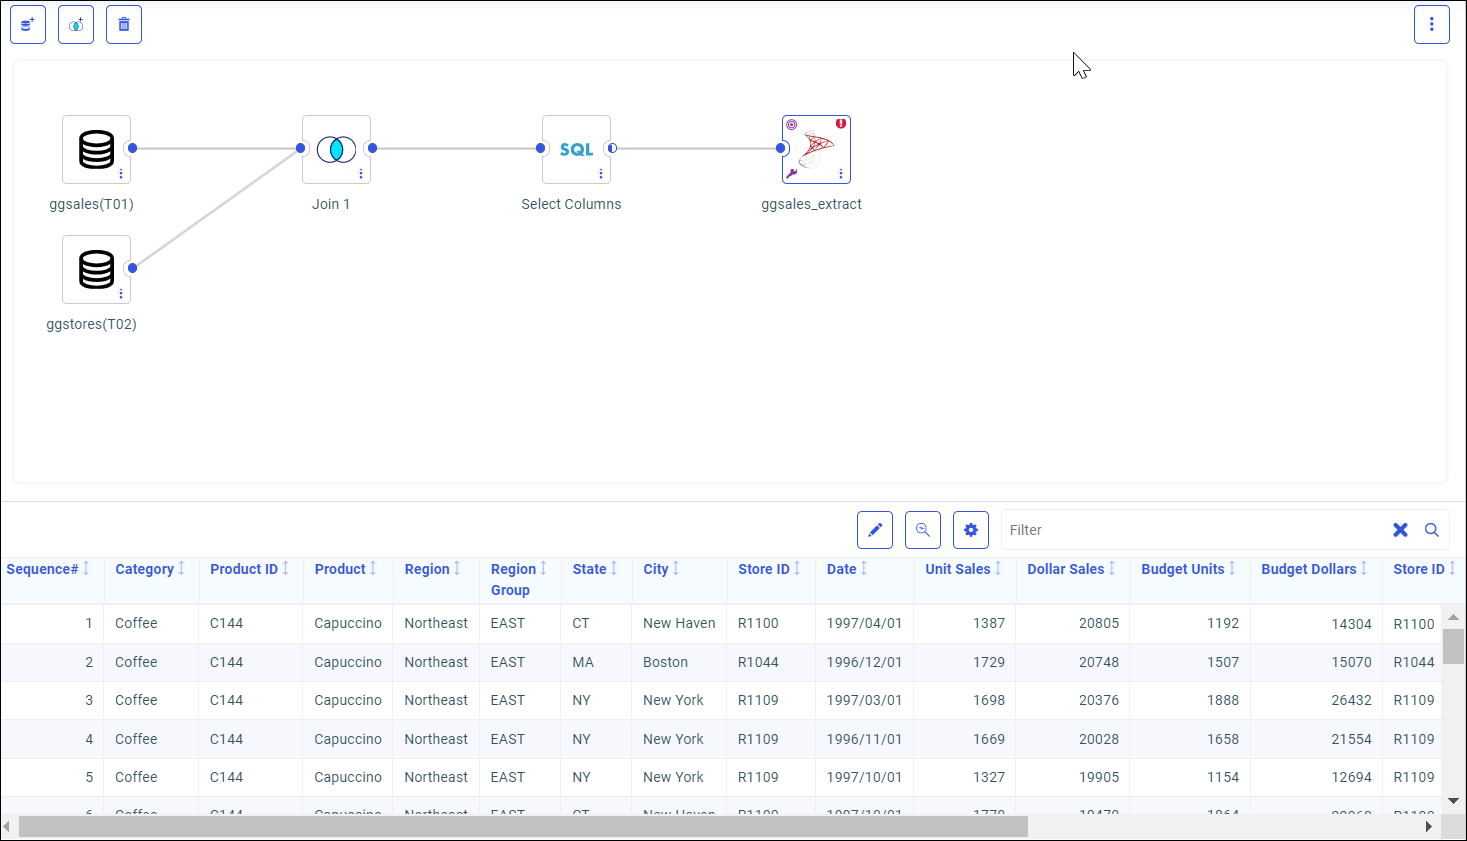
You must run the flow to finish creating the extract.
- Click the Run arrow icon.
Your HOLD file is created and saved to your chosen location. It can be used immediately on the Visualization tab, or selected from your list of data sources for future reports and visualizations.
Note: You can switch back and forth between the Data and Visualization tabs. Modifying your data flow may change or delete any associated visualizations. For more info on creating visualizations, see Creating Content in TIBCO WebFOCUS Designer.