Using a JavaScript Function to Navigate to a Designer Portal Page

In this section:

You can use a JavaScript function to dynamically navigate to other pages within your Designer portal, and immediately filter them based on the value that you select. This feature is especially useful in portals that contain multiple portal pages, because it allows you to link to a specific page within it. You can also pass a parameter from a link in the source item to filter the content in the target page, such as charts or reports, to quickly navigate through and show related information in different areas of your portal.

To use the navigateToPage function to jump from one page in a portal to another, perform the following tasks:

  1. Create Parameterized Content. Create charts and reports to which the links in your source report will point.
  2. Set Up a Portal for the Navigate to Page Function. Create the landing page for the links and save it in a portal.
  3. Create Hyperlinks in a Source Report. Create hyperlinks within a report, which you will configure to point to a page containing the parameterized content.
  4. Add the Source Report to a Page in the Portal. Add the source report to a page and add it to the same portal to which the target content was added.
  5. Finalize the Configuration of the JavaScript Function. Ensure that the navigateToPage JavaScript function can be executed by the source report.

Stage One: Creating Parameterized Content

How to:

In this stage, you build parameterized reports and charts that will serve as the targets for drill-down links in the source report that you will create later.

It is prudent to build this content before creating the source report for a couple of reasons. First of all, these content items generally show detailed information that expands upon the information in the report. You can decide upon the information that you want to show in these target items, and how they should be filtered. Additionally, when you create the drill-down links in the source report, you will need to provide the parameter that you want to pass to these target items, and include the associated field in the source report. You will also need to include the IBFS path to the page that contains these target items. Therefore, it will be easier to create the target items and add them to a page in the portal first, then add the source report that targets them to a new page in the same portal.

Procedure: How to Create Parameterized Content for Hyperlinks

  1. From the WebFOCUS Hub, click the plus button, then click Create Visualizations.

    WebFOCUS Designer opens.

  2. Select a data source. This data source should be used for both the target content that you are creating now, and the source report that you will create later.
  3. Optionally, change the content type using the Content picker. The default content type is a vertical stacked bar chart.
  4. Drag fields from the Data pane onto the canvas or into the appropriate buckets on the Settings tab to create a chart or report.
  5. Drag a dimension field from the field list to the Filter toolbar to create a prompted filter.

    You will also add this field to the source report later, and create a drilldown to pass a selected value from the source report to the parameterized content that you are creating now. You do not need to select default filter values.

  6. Optionally, repeat step 5 to create more filters for this item. You can add all of these fields to the drilldown source item to pass values for multiple fields at once.
  7. Save your content and close WebFOCUS Designer.
  8. Optionally, repeat steps 1-6 to create more content to add to the target page. Filter these items with the same field or fields if you would like to filter them all based on the value selected in the source report.

    Optionally, you can also click Convert to Page and then add new containers to create additional charts and reports in the same page on demand. If you choose to create new content directly within a page using this authored page workflow, skip steps 3 through 6 in Stage Two.

Stage Two: Setting Up a Portal for the Hyperlinks

How to:

In this stage, you will create a portal to which you will add a page containing the target content that you created previously.

Procedure: How to Set Up a Portal for the Hyperlinks

  1. Create a portal.

    On the WebFOCUS Hub, in the Workspaces area, select the folder in which you want to create your portal, then, in the +Content menu, point to Application, and then click Portal.

  2. Give the portal a title, and optionally specify an alias, layout, and other configuration options.

    Click Create to create the portal.

  3. Create a new page. Click the plus menu and then click Assemble Visualizations.

    WebFOCUS Designer opens.

  4. Select a page template, or use the Blank template to arrange the content on the page yourself.

    Once you select a page template, the page canvas opens.

  5. Add the target content that you created in Stage One to the page.
  6. Since you added prompted filters to the target content, a badge appears on the Filters tab on the sidebar.

    Select the Filters tab on the sidebar and then click Add all filters to page.

    Controls for all parameters are added to the Filter toolbar.

  7. Save the page to the portal folder that you created in step 2, and then return to the WebFOCUS Hub.

Stage Three: Creating Hyperlinks in a Source Report

How to:

In this stage, you will create a simple report with hyperlinks that point to the target page in the portal.

Procedure: How to Create a JavaScript Drilldown in a Report

  1. On the WebFOCUS Hub, click the plus menu and then click Create Visualizations.

    WebFOCUS Designer opens.

  2. Select the same data source that you used to create the target content in Stage One.

    This report will contain drilldowns that pass parameter values to those target items, opening and filtering the page containing them when a link is clicked.

    After you select a data source, the WebFOCUS Designer canvas loads.

  3. Optionally, change the content type by selecting an option from the Content picker.

    In this example, we will create a report, since drill-down links in reports appear as easily identifiable hyperlinked text values. Therefore, we will select either the grid or standard report content type. However, you can add drilldowns to any standard chart type as well. Drilldowns added to charts are available from tooltips when you point to an area of the chart.

  4. Drag fields from the Field list into the appropriate buckets in the report. Add dimension fields to the Rows and Column Groups buckets, and measure fields to the Summaries bucket.

    Make sure to add the field by which the target items are filtered to the Rows bucket.

  5. The next step is to create drill-down links on the field that was used to filter the target items. Complete the following steps to add a JavaScript drilldown that navigates to the page that you created in Stage Two.
    1. Right-click that field in the Rows bucket and click Configure drill downs. The Configure Drill Downs dialog box opens.

      If you added filters for multiple different fields to your target items, add the drilldowns to the lowest level sort field. Associated values for higher level sort fields will be included automatically.

    2. Click the plus sign (+) button to create a new drilldown.
    3. Select the JavaScript radio button to create a JavaScript drilldown.
    4. In the JavaScript Function text box, type portalDispatch.
    5. Add parameters to use in the portalDispatch function.

      Click the plus sign button in the Request Parameters section to add the first parameter.

    6. For the first parameter, change the Type to Value using the drop-down menu, and type navigateToPage in the Field/Value column.
    7. Add a second parameter by clicking the plus sign button. Change the Type to Value and enter the IBFS path to the drilldown target page that you created in Step Two into the Field/Value column.

      You can acquire the IBFS path of the page by right-clicking it in the object explorer on the WebFOCUS Hub clicking Properties. Copy the text in the Path field of the Properties panel, then paste it into the Field/Value column for the second drilldown parameter in the Configure Drill Downs dialog box in WebFOCUS Designer.

    8. Add a third parameter. Change the Type to Value and, in the Field/Value column, type the name of the parameter that you want to pass.

      Typically, the parameter name matches the name of the field. You can confirm the parameter name by opening the target page in WebFOCUS Designer, clicking the Info button, and noting the parameters listed in the Parameters/Filters category for the items on the page. Alternatively, select a filter control on the page and, on the Settings tab, scroll down to the Parameters section, which shows the name of the parameter associated with the filter control.

    9. Add a fourth parameter. Leave the Type as Field and select the field in your report that is associated with the parameter that you are passing. This field must be present in the drilldown source content.
    10. Optionally, if you wish to pass multiple parameters to the page, for example, if the page contains multiple filters, repeat steps 5h and 5i for each one.

      The following image shows the parameters to drill to a page in a portal, passing values for both the PRODUCT_CATEGORY and TIME_YEAR parameters.
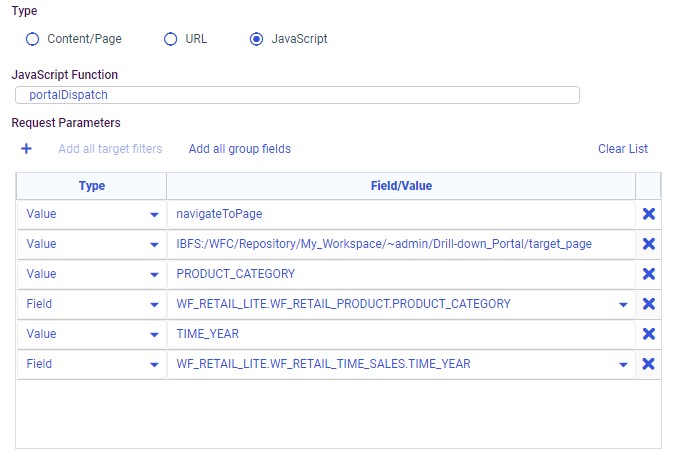

      Parameters set in Configure Drill Downs dialog box
  6. Click Apply to generate the drill-down links.

    The hyperlinks are added to the entries of the selected field.

    Note: The links remain inactive until the drilldown source report or chart is added to a page within the same portal as the target item.

  7. Save the report.

Stage Four: Add the Source Report to a Page in the Portal

How to:

The drilldown source report or chart should be run within the same portal as its target item. Therefore, it should be added to a page within that same portal.

Procedure: How to Add a Report to a Page in a Portal

  1. Create a new page. Click the plus menu and then click Assemble Visualizations.

    WebFOCUS Designer opens.

  2. Select a page template, or use the Blank template to arrange the content on the page yourself.

    Once you select a page template, the page canvas opens.

  3. Add the drilldown source content that you created in Stage Three to the page.
  4. Optionally, add other complementary items to the same page.
  5. Save the page to the portal folder that you created in Stage Two, and then return to the WebFOCUS Hub.

    Alternatively, you can save the page to another location in your Repository, and instead create a shortcut to that page within the portal folder structure.

  6. You may wish to display the drill-down source report on the first page, so that you can quickly navigate to other items within the portal using the drill-down links instead of the portal tabs and menus. To ensure that the page containing this report appears first, set the sort order for the page or shortcut within the portal.
    1. Right-click the page or page shortcut that you want to appear first within the portal, and then click Properties.

      The Properties panel opens.

    2. Select the Advanced tab of the Properties panel.
    3. Type a numeric value in the Sort order text box.

      Items with lower sort order values appear first. Since we want the page with the drilldown source report to appear first, type a negative value, such as -1, into the Sort order text box, causing it to appear before items with the default sort order of 0.

    4. Click Save in the Properties panel to apply the new sort order.

Stage Five: Finalize the Configuration of the JavaScript Function

How to:

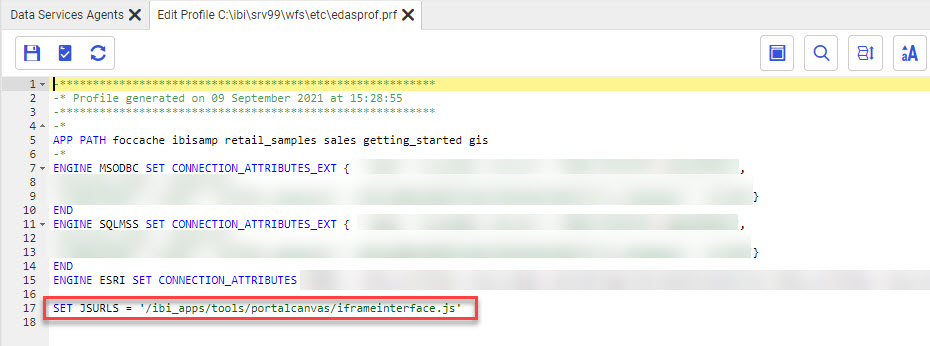
The portalDispatch JavaScript function is defined in a .js file in your WebFOCUS installation. In order for WebFOCUS to find and execute this function, you must configure the path on the WebFOCUS Reporting Server edasprof.prf profile using the JSURLS property. Properties set in edasprof.prf are applied to any procedures run against that WebFOCUS Reporting Server.

Procedure: How to Add a JavaScript File Path to edasprof.prf

  1. On the sidebar of the WebFOCUS Hub, select the Management Center.
  2. Under the Server Administration section, select Server Workspaces. The Workspaces view of the WebFOCUS Reporting Server browser interface opens.

    Alternatively, navigate to the WebFOCUS Reporting Server browser interface using the URL:

    hostname:HTTPport

    where:

    hostname

    Is the name of the machine where the WebFOCUS Reporting Server is hosted.

    HTTPport

    Is the HTTP(S) port number. If running against HTTP, the default value is 8121.

    When running locally, the default address of the WebFOCUS Reporting Server browser interface is localhost:8121.

    In the Reporting Server browser interface, open the Tools menu , and click Workspace.

  3. On the Server Workspaces page, in the resource tree, expand Configuration Files, right-click Server Profile - edasprof.prf, and click Edit.
  4. On a new line, paste the following text:
    SET JSURLS = '/ibi_apps/tools/portalcanvas/iframeinterface.js'

    Note: If your environment does not use the default context root, replace the ibi_apps context root in the JSURLS path above with the one used in your environment.

    Once added, your environments edasprof.prf file may resemble the following image.


    edasprof.prf file in the Workspaces area with JSURLS property added
  5. Save your edits to edasprof.prf.
You can now drill from the drilldown source report to the target page that you created. In the Workspaces view of the WebFOCUS Hub, right-click the portal in the object explorer or Resource tree and click Run. When the portal loads, click a drill-down link in the report. The target page loads and is automatically filtered for the value that you selected in the report. To filter the page again for a different filter value, select a new value from the filter control and click the Refresh button on the page toolbar.