Procedure: How to Create a Dynamic Group
- Open WebFOCUS Designer. On the WebFOCUS Hub, click the plus menu and then click Create Visualizations, or, on the WebFOCUS Home Page, click Visualize Data.
WebFOCUS Designer opens in a new browser tab.
- Select a workspace and a data source available from that workspace.
Once you select a data source, WebFOCUS Designer loads with options to create a single content item.
- On the Resources pane, with Fields selected on the sidebar, right-click the data field for which
you want to apply dynamic grouping.
Note: You can use the dynamic grouping functionality on non-numeric dimension fields only.
- Click Group values.
The Create Groups dialog box displays.
- In the Field text box, optionally type a name for the
new group field.
Note: The fully qualified field name is displayed as the Origin Field at the bottom of the Create Groups dialog box. The display of the fully qualified field name is particularly useful when renaming or editing a group, as it identifies the data source followed by the hierarchical location of the field within a data set. For example, WF_RETAIL_LITE.WF_RETAIL_PRODUCT.BRAND.
- Create a group of values in one of the following ways:
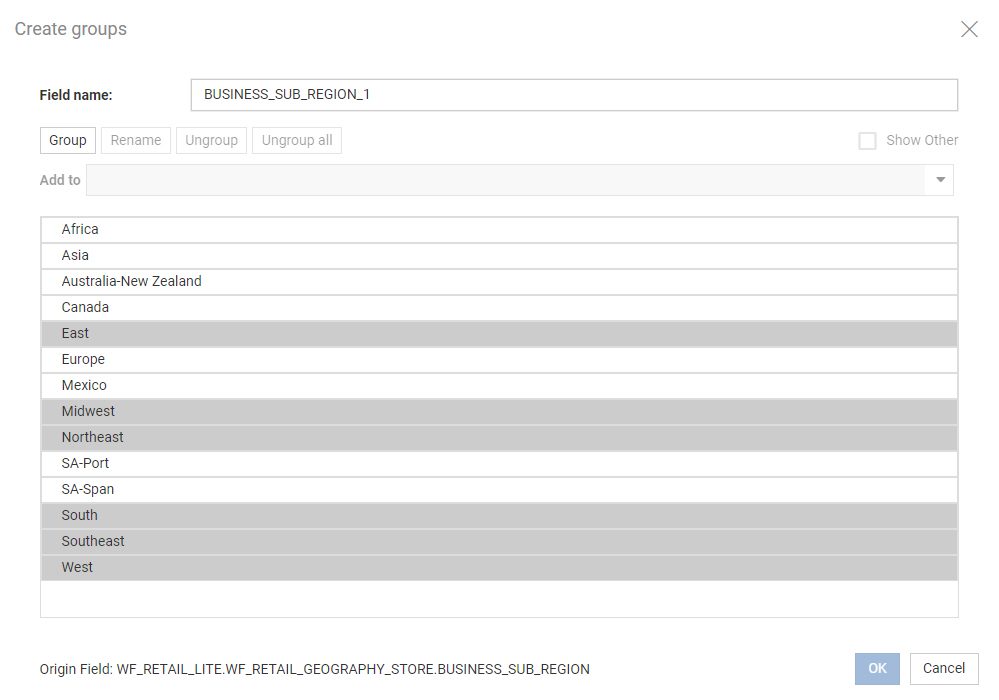
- Use Ctrl
+ click to select more than one value, as shown in the following
image, then click Group.

- Drag one value onto another value. The two values are grouped.
- Use Ctrl
+ click to select more than one value, as shown in the following
image, then click Group.
- Optionally, double-click the group title or select a group and click Rename, and then type a new name for the group.
- Optionally, add more values to the group that you just created using one of the following methods:
- Select one or more values, open the Add to menu, and select a group to add the values to.
- Select one or more values and drag them into a group.
- Drag the group onto a single, ungrouped value. The value is added to the group.
- If you have multiple groups, drag one group into another group to merge them. The name of the target group is retained for the merged group.
These methods can also be used to move a value from one group to another group.
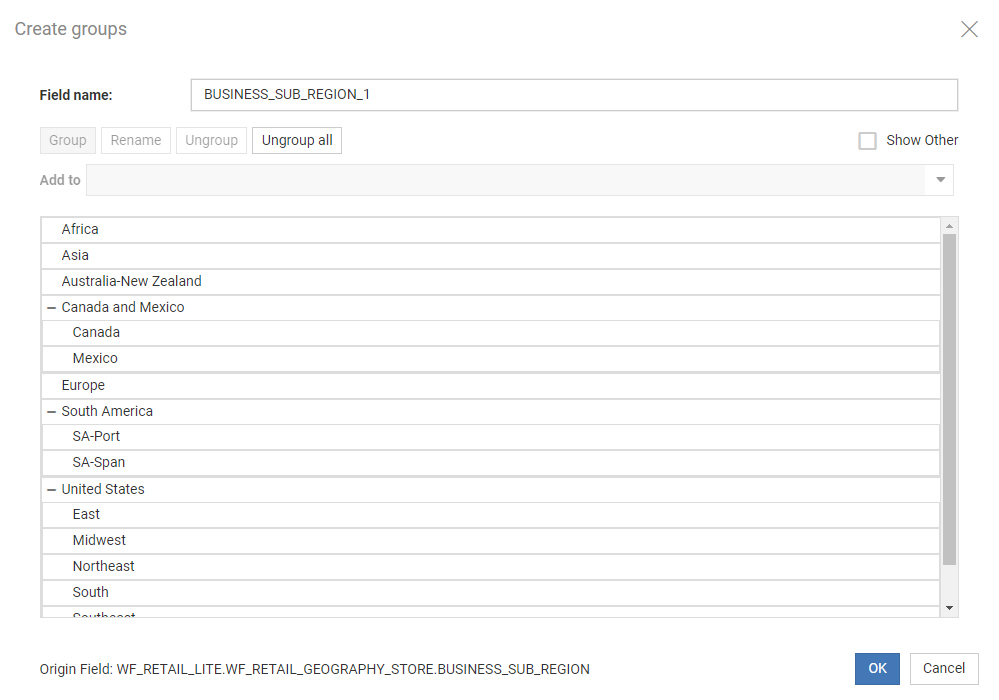
- Optionally, create additional groups using the methods in step 7, as shown in the
following image.

- Optionally, to ungroup values, click a group and then click Ungroup. Click Ungroup all to disband all groups.
- Optionally, click Show other to add all remaining non-grouped values to an Other group.
Note: If you add all values to the Other group, all groups, including the Other group, are disbanded. You must have at least one group for the Other group to be available.
- Click OK.
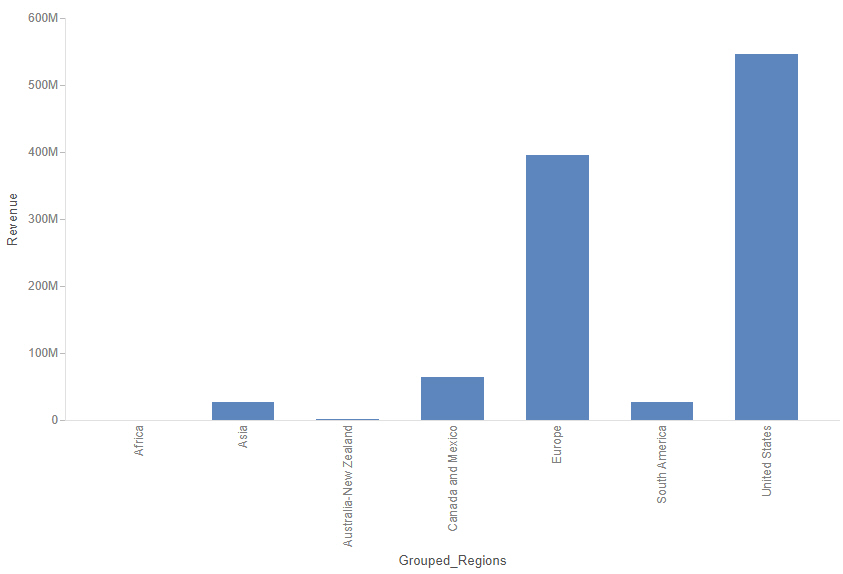
Your grouped data will display as a new field in the Resources panel. If it is not immediately visible, you can use the search feature on the field list to find it. From there, you can add the grouped field to your content, as shown in the following image.

To edit the grouped field, right-click it in the Resource panel and click Edit group values.