Procedure: How to Access Predictive Models
After you create a Data Flow, you can select from different model algorithms to run against your data set.
- From the WebFOCUS Hub, click the plus menu, and then click Create Visualizations.
- Select a data source from the dialog.
- Click Prepare/Extract Data.
Your data source opens in the Data tab.
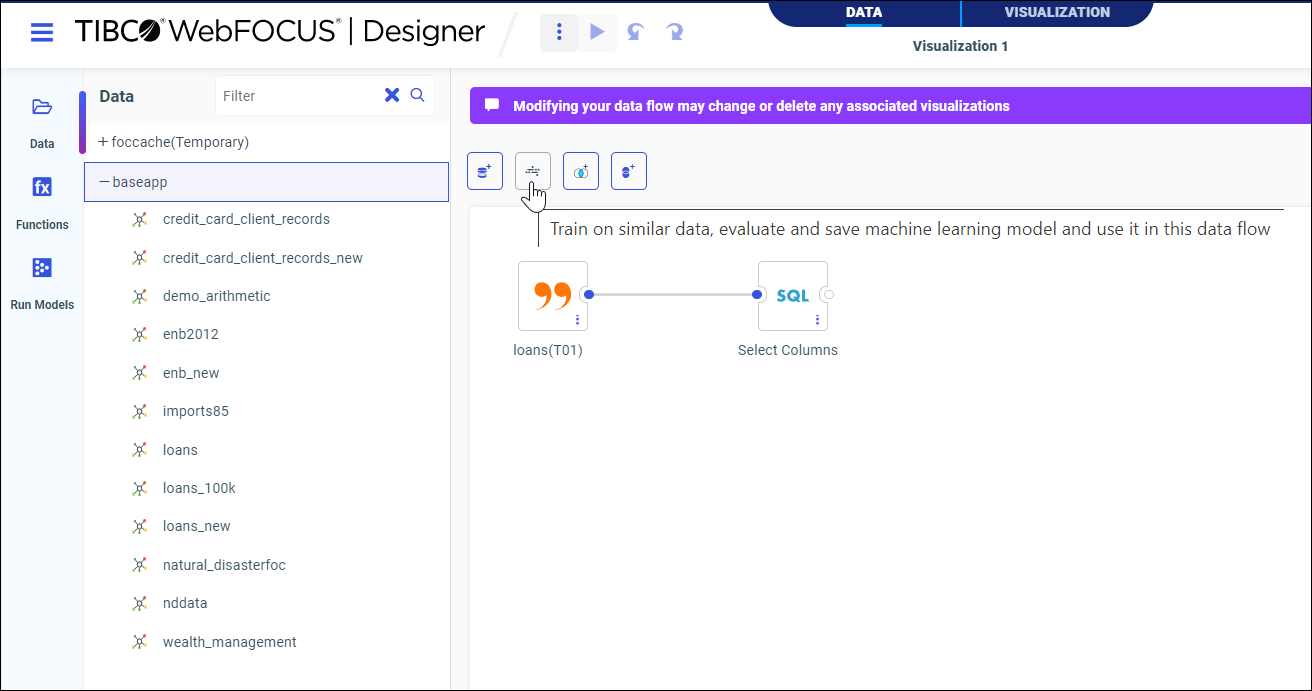
- Click the Train Models icon, as shown in the following image.

A file directory dialog box opens.
- Select a file with similar data on which you can train your data and create a predictive model.
- Click OK.
- Double-click or drag a model type from the Train Models panel onto the canvas.
A configure dialog box displays. You can select a target, predictors, or datetime parameters, depending on your chosen model type. For more information on model types, see Running Predictive Analytics on Your Data.
- Click Apply.
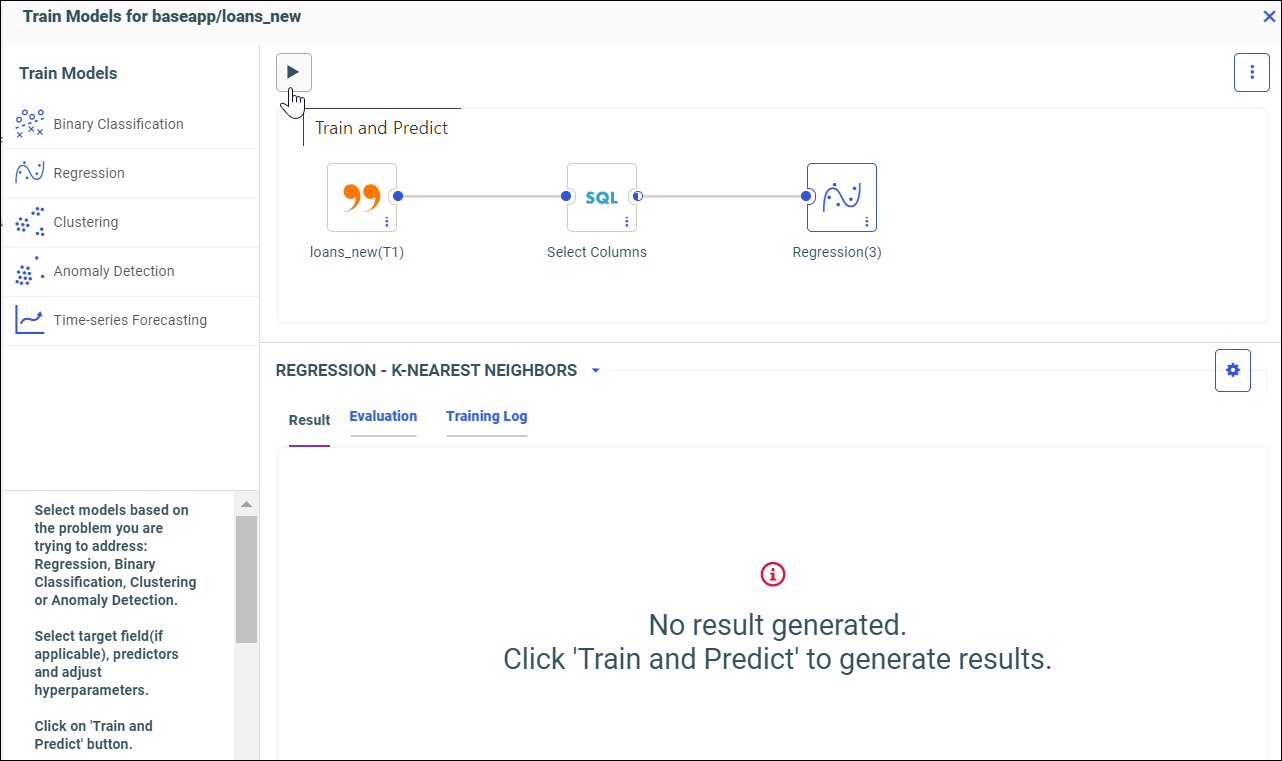
Your model, in this case a Regression model, is added to the workflow.
- Click the Train and Predict button, as shown in the following image.

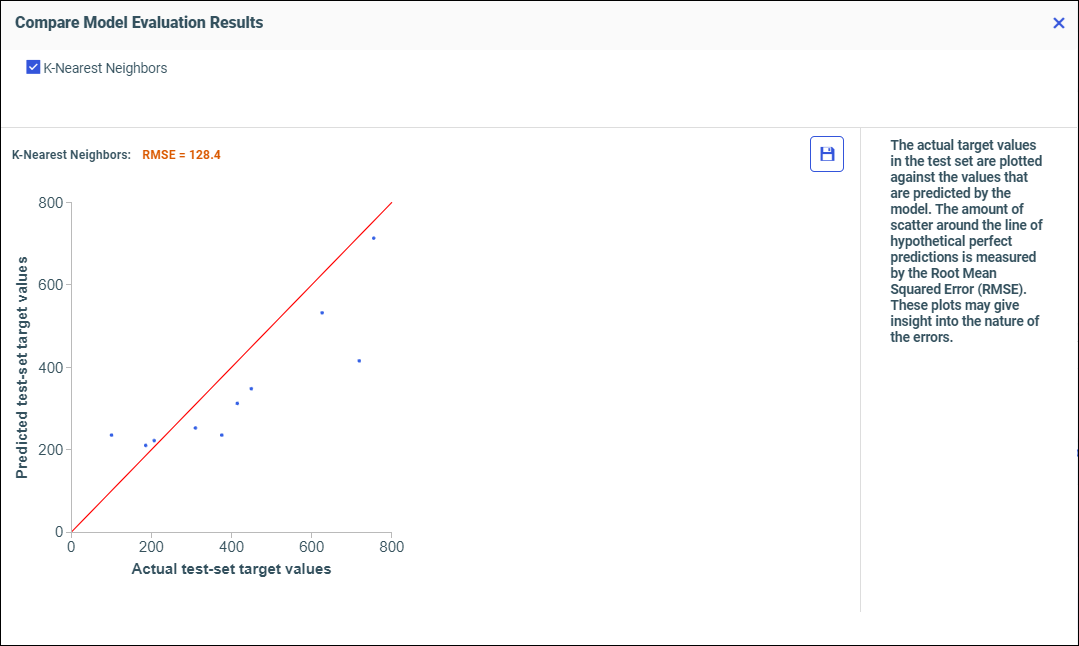
Your trained model is visualized in the Compare dialog box, as shown in the following image.

Review the performance of the trained model. If there is more than one visualization, you can compare them and select the best one to save. You can save your model by clicking the Save icon in the dialog box.
- Close the dialog box to return to the data tab.
Your model data displays in different tabs in the sample data panel, as shown in the following image.

You can select different algorithm display options, according to your model type, from the model drop-down menu. The best algorithm is selected by default.
- Click the Save icon from the sample data panel.
The Save dialog displays. You can review and change attributes, including the application folder where to save your trained model.
- Click the dialog Save button.
Note: The saved model can be run later against new data, similar to one it has been trained on. To run your saved model in a Data Flow, click Run Models from the left panel, and drag and drop your saved model onto the canvas. For more information, see How to Run Datasets Against Saved Models.