As you create content and pages in WebFOCUS Designer, you can preview them to see how your data displays in the chart, or
to check the styling, run-time behavior, and filtering before publishing or sharing it with others. At any point in the development
of your visualization, click Run in new window ![]() .
.
Clicking Run in new window runs the visualization in a new browser tab, allowing you to view your content at run-time while continuing to edit it in a separate window. If you click Run in new window again, the content is reloaded in the same new tab.
Once it is saved, you can also run your content from the WebFOCUS Hub or WebFOCUS Home Page by right-clicking it and clicking Run.
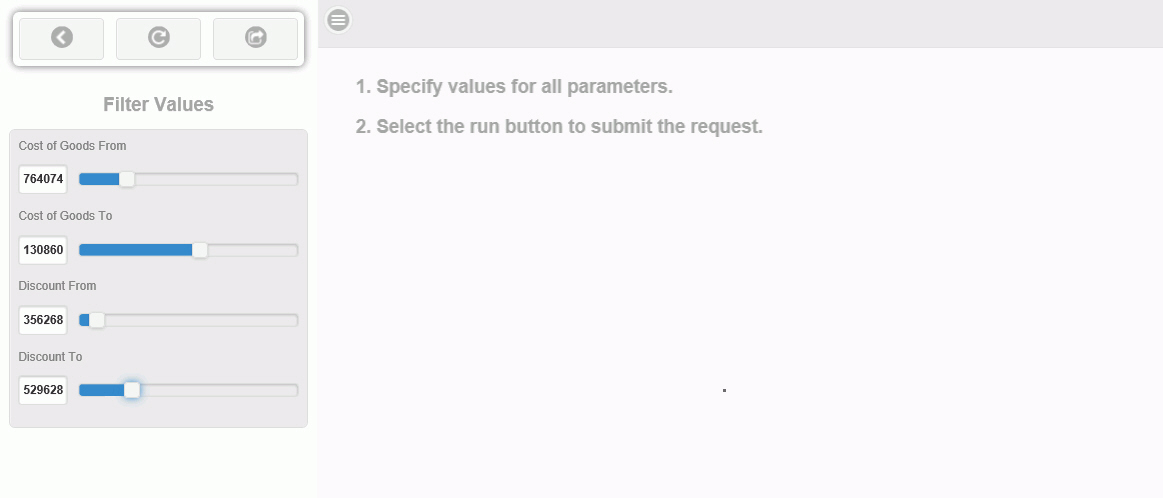
When you preview stand-alone charts and reports that contain required filter prompts, you are presented with an Autoprompt page. You can use the filter controls to set values for each filter, as shown in the following image.
