Using Breaks and Subtotals on Rows in a Report
The Subtotal options allow you to add a subtotal or recompute row after each value in the selected field. Subtotals and recomputes do not add page breaks to a report.
To add a subtotal, right-click a field in the Rows bucket, point to Insert breaks, and click Aggregate columns. A subtotal row is added for each value in the selected field and evaluated for each measure field in the report.
The selected field does not need to be the primary sort field. For example, the following image shows a report with subtotals for Product Subcategory, the secondary sort field, but not Product Category, the primary sort field. You can add subtotals for each sort field separately.
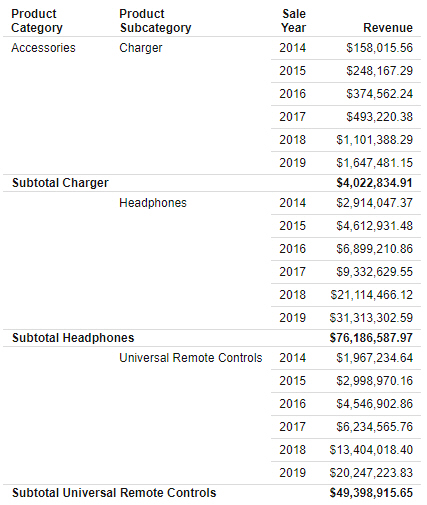
Alternatively, you can use the recompute option to provide summed totals for fields from the data source but recalculate the total values for computed fields created in a report. To add recompute rows to a report, right-click a field in the Rows bucket, point to Insert breaks, and click Recalculate totals. Values for each measure field are recomputed after each value in the selected field.
For example, perhaps you have created a report that includes a calculated field, Revenue Per Item, that is evaluated after aggregation from Revenue divided by Quantity Sold. The following image shows a report containing that field, with subtotals added using the Aggregate columns option.
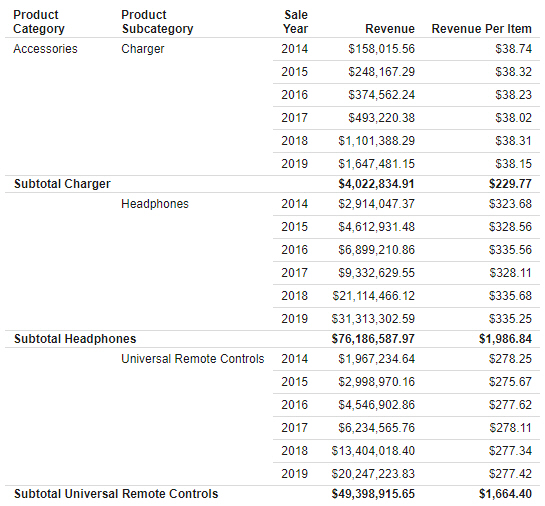
The subtotal rows each contain summed values for the Revenue and Revenue Per Item fields.
By contrast, the following image shows the same report, but with recomputes, using the Recalculate totals option, instead.
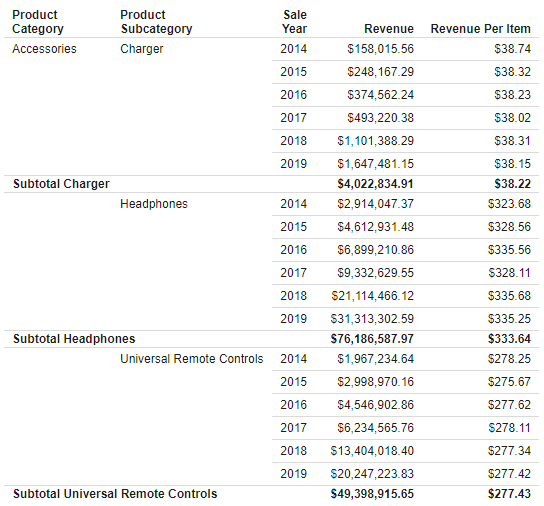
Now the subtotal rows provide reaggregated values. They provide a sum total value for the Revenue field, just like with a subtotal, and a recalculated value for the Revenue Per Item field.
Note that the Recalculate totals option does not reapply prefix operators. Fields with prefix operators are summed just as they would be when applying a regular subtotal. Only COMPUTE fields, which are calculated fields evaluated after data aggregation, are recalculated.
You can create subtotals and recomputes with more advanced options, such as different aggregations and cascading to all higher level sort fields, by right-clicking a field in the Rows bucket, pointing to Insert breaks, and clicking More options. The Configure Subtotals dialog box opens, as shown in the following image.
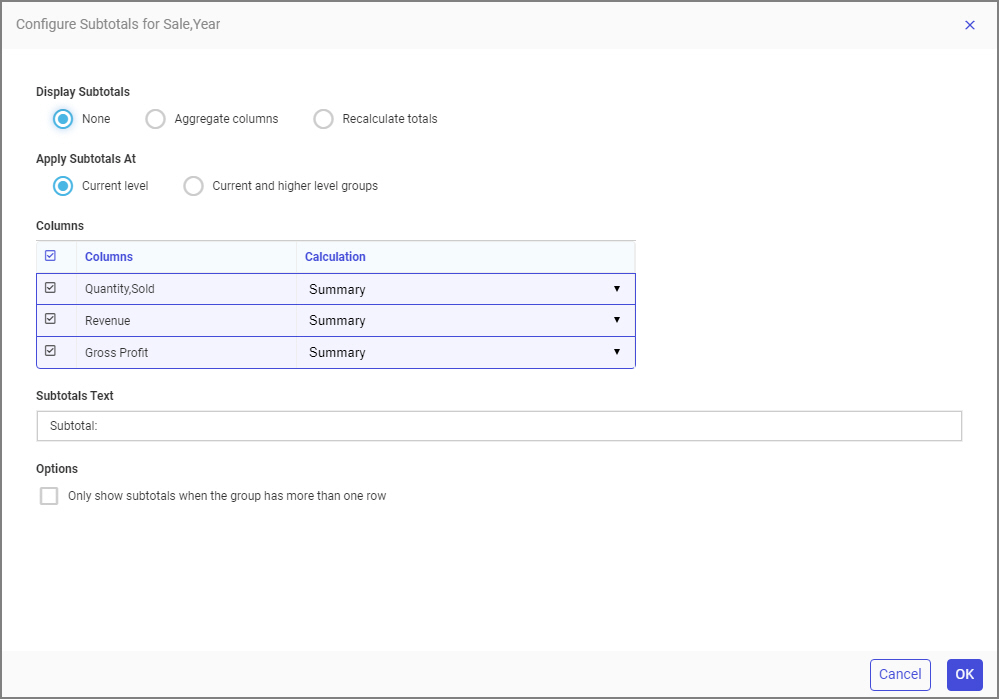
Select the Aggregate columns radio button to create subtotals, or the Recalculate totals radio button to create recomputes. You can then choose to create subtotals or recomputes at the current levels, that is, the selected field, or for current and higher level sort fields. If you select Current and higher level groups, then the same subtotal settings are applied to all higher level fields in the report. Pre-existing subtotals or recomputes are not replaced. Note that the specified subtotal label text is not used for the higher level sort fields.
A grid in the Configure Subtotals dialog box shows a list of measures fields in the report. Select any or all check boxes to indicate which fields should be subtotaled or recomputed. You can also change the prefix aggregation for each one. For example, instead of a summed total, you can show a total average or total count for a selected measure column.
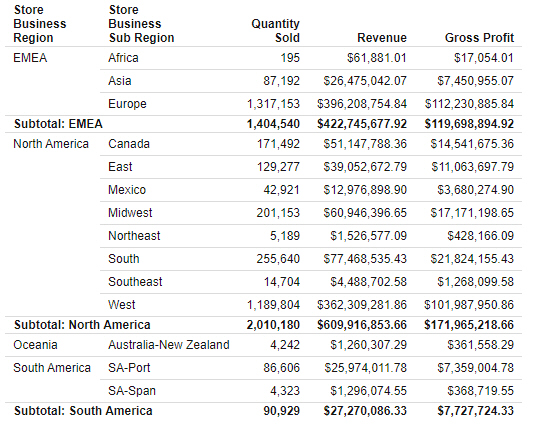
You can also change the text that appears in the subtotal rows of the report, and choose whether break groups with only one row should also be subtotaled. The subtotals for these groups would be the same as the measure values displayed in the group itself, so you may prefer not to subtotal them. For example, the following image shows a report with subtotals on the Store Business Region field. Since the Oceania business region occupies only one row, and the Only show subtotals when the group has more than one row option is selected, it is not subtotaled.
Click Apply to create the subtotals or recomputes as you configured them.
If you create subtotals and apply them to all higher fields, and then right-click a higher level sort field and point to Insert breaks, only the More options option is available for subtotals. If you click More options, the Configure Subtotals dialog box opens with options to edit the cascaded group of subtotals from the lower level sort field. If you change the Apply Subtotals At option from Current and higher level groups to Current level, then the cascaded group of subtotals are removed except for the field that you right-clicked.
You can also add page breaks to a report using two different options. Right-click a field in the Rows bucket, point to Insert breaks, and click Continuous numbering or Restart at 1 to split the report into separate pages for each value in the selected field.
Page headers and footers appear at each page break. Page headers and footers can use dynamic text to indicate the values on the page. Dynamic text is added by typing a less-than sign (<) markup tag followed by the name of the field, with no spaces between them.
For example, the following image shows a report with page breaks added for the Product Category field, and page headers added by typing Sales for <PRODUCT_CATEGORY in the page header area of the report.
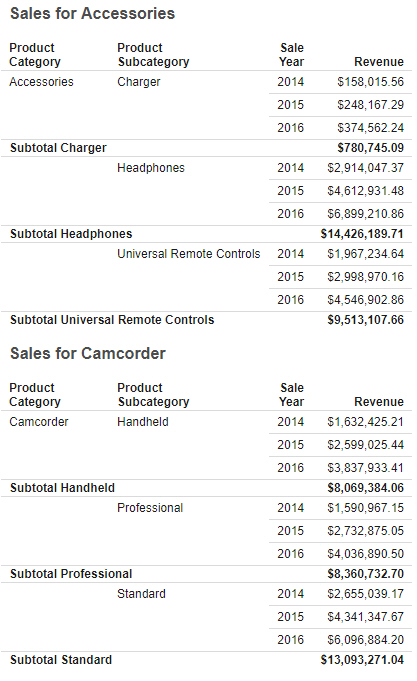
There is no difference between the Continuous numbering and Restart at 1 page break options unless there are page numbers added to the report. If there are page numbers, then using the Continuous numbering option counts page breaks for all values in the field toward page numbering, while the Restart at 1 option resets the page count for each value in the selected field. You can display page numbers by adding the dynamic text <TABPAGENO to a page header or footer.
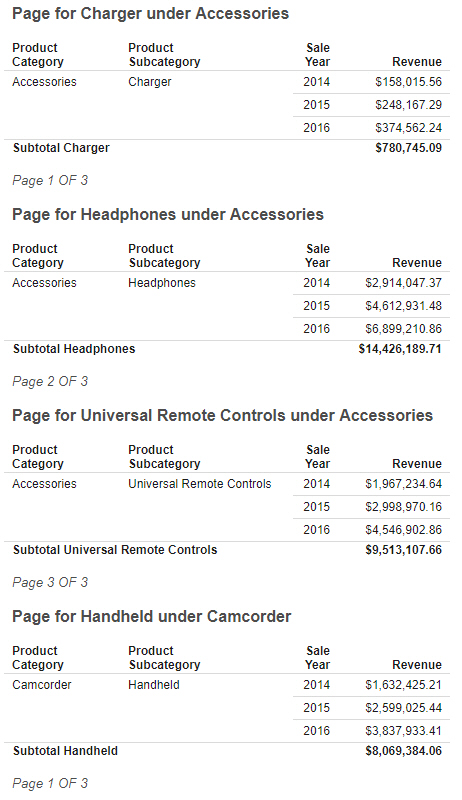
The Restart at 1 option can be used on a higher level sort field to control the displayed page number for lower-level sort field page breaks using the Continuous paging option. For example, the report shown in the image below uses the Restart at 1 page break option on Product Category, the primary sort field, and the Continuous numbering option on Product Subcategory, the secondary sort field. It also contains the following page footer text:
Page <TABPAGENO of <BYLASTPAGE
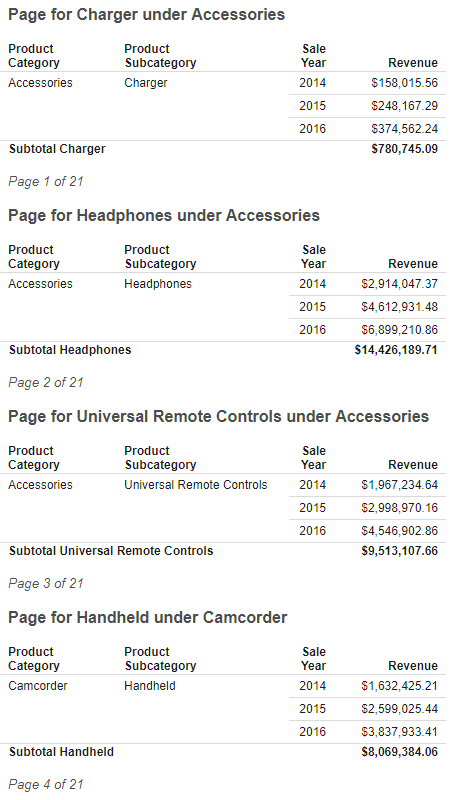
At run time, <TABPAGENO provides the current page, and <BYLASTPAGE provides the page count for the sort field using the Restart at 1 option. Using <TABLASTPAGE instead of <BYLASTPAGE would instead provide the total page count.
The following image shows that the page for each Product Subcategory is numbered, while different values for Product Category cause the page numbers to reset.
By contrast, if Product Category used either the Continuous numbering option or no page breaks at all (since breaks have already been added on a lower level sort field, Product Category values will display on separate pages anyway), <BYLASTPAGE would display the total number of all pages in the report, as shown in the following image, and <TABPAGENO would not reset.
To visually break up a report without adding page breaks, you can add a row break in the form of a blank row or line. To add a row break, right-click a field in the Rows bucket, point to Insert breaks, and click Blank row or Solid line.
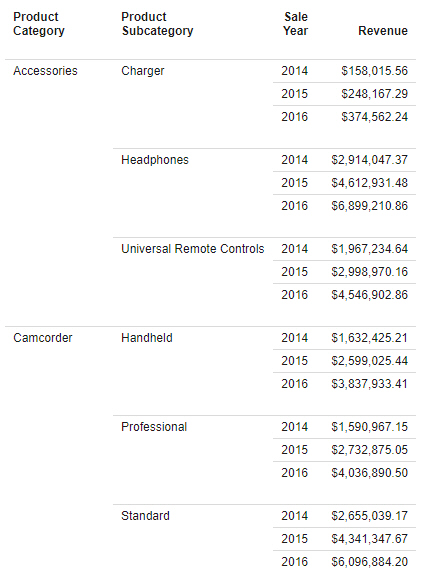
Row breaks do not create page breaks, so page headers and footers are not repeated on the field to which the row break is added, and they are not counted for page numbering. This technique can be a good way to space out the values and information in a report without adding unnecessary functionality. In the following image, blank row breaks on Product Subcategory make it easier to locate and isolate the values for each product subcategory.
