Procedure: How to Convert a Report to an Excel Table
- Create a report as described in Creating Reports.
- In the Output Format menu above the canvas, select XLSX.
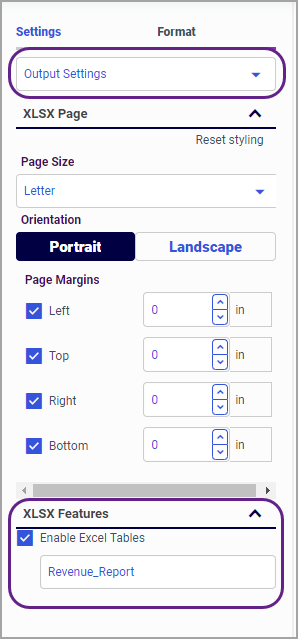
- In the Settings/Format pane, click Format, and select Output Settings from the drop-down menu.
- In the XLSX Features section, select the Enable Excel Tables checkbox and, optionally, edit the name field below to give your Excel table a unique identifier.
An example of the fully configured Format pane for an Excel-optimized report is shown in the following image.

- Save your report and exit WebFOCUS Designer.
- On the WebFOCUS Hub, right-click your newly-created report, and click Run.
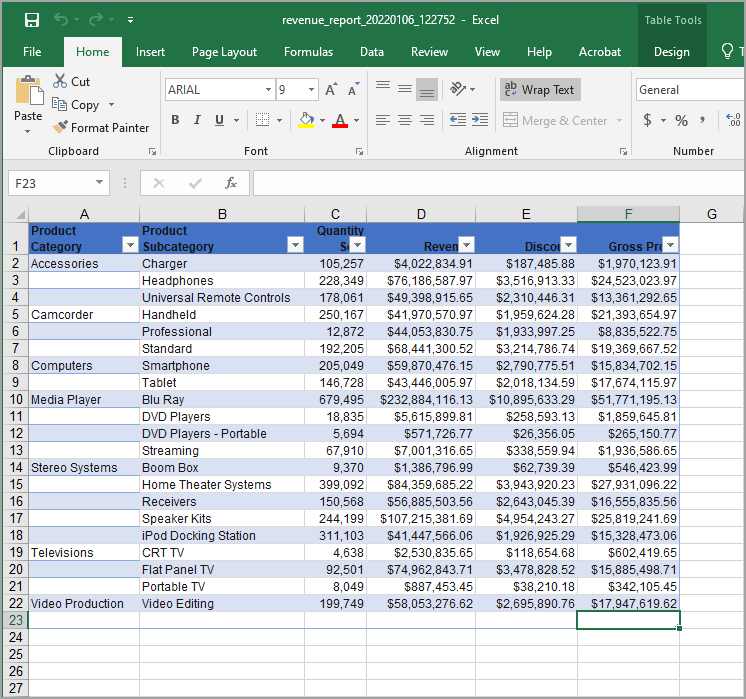
The Excel file with the report automatically downloads to your computer. An example of the Excel version of the report created in WebFOCUS Designer is shown in the following image.

You can now use Excel features to modify and enhance your report.