In this section: |
How to: |
OLAP reports and graphs appear in your browser in HTML format. You can display the report and corresponding graph in PDF, Excel, and active report formats, and in folders within the Repository path.
The following save and/or display options are available:
When you choose PDF format, the report appears in Adobe Acrobat Reader and the graph continues to appear above it in a browser window. If you print from Acrobat, only the report will be printed.
Drill-downs of any kind are not supported.
When you choose Excel 2000, the report and graph are displayed in the same tool where you can manipulate the data using Excel options. From Excel, you can print both the report and the graph.
When you save in Excel 2000 format, only explicit drill-downs (based on parameters passed from the base report to the drill-down report) continue to work. Automatic drill downs on Dimensions and Measures are not supported in Excel.
In the Repository path:
The graph appears in the browser above the report, while a second browser opens and launches the report output in Adobe Acrobat, as shown in the following image.
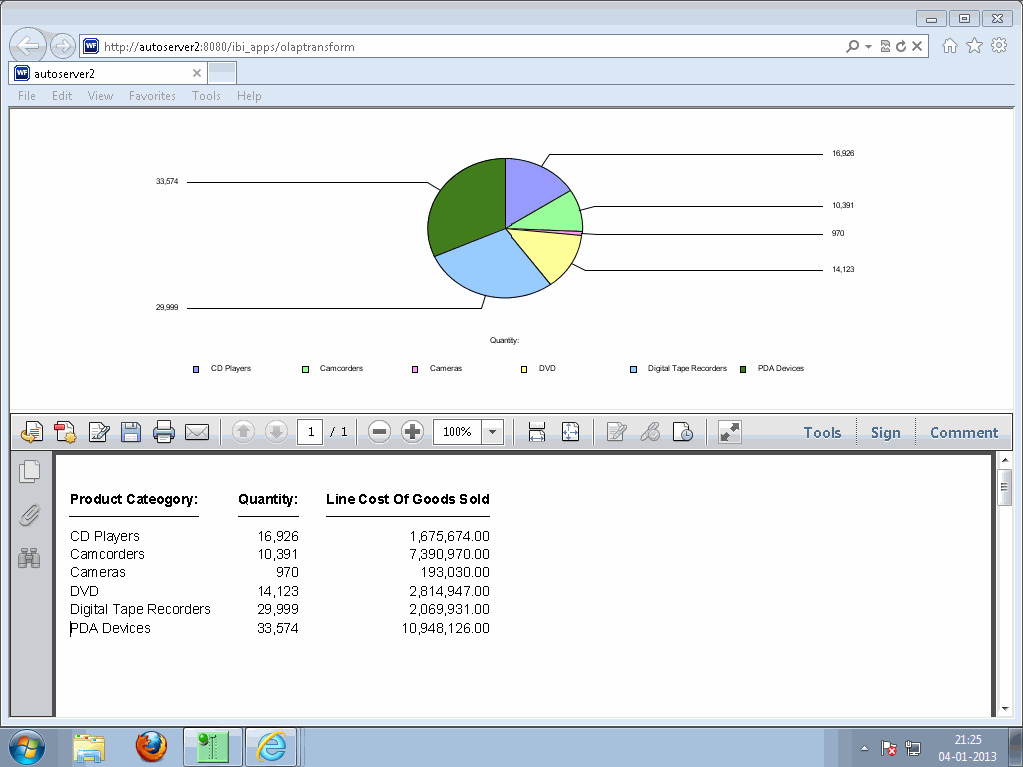
Tip: If you wish, you can save and print the PDF report from Adobe Acrobat.
Note: The Excel Save options are controlled by the TIBCO WebFOCUS® Client configuration OLAP settings. For more information, see the TIBCO WebFOCUS® Security and Administration manual.
In the Repository path, you can save an OLAP report and graph in your private content folder.
A secondary window opens.
Note: There is no limit to the number of characters in the label legend of a graph, but long labels may appear truncated.