Procedure: How to Access Servlet Tracing
- Navigate to the Administration Console.
- Click the Diagnostics tab.
- On the Diagnostics
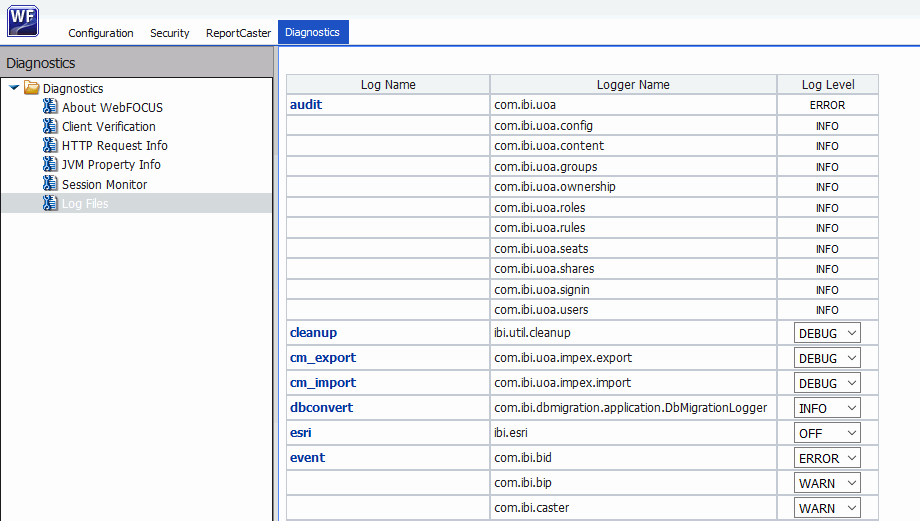
tab, under the Diagnostics folder, click Log Files.
The list of log files appears, as shown in the following image.

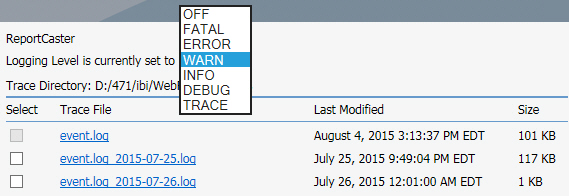
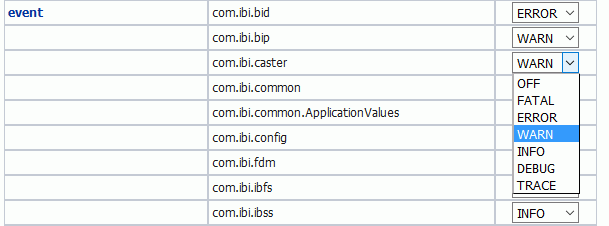
- In the Log Level column, select the type
of information from the log file that you would like to access,
as shown in the following image.


The ReportCaster Log Level option provides the following levels of diagnostics information:
- OFF. Capture no events.
- FATAL. Capture only events that disrupt system operations.
- ERROR. Capture events that generate error messages in addition to fatal events.
- WARN. Capture events that generate warning messages in addition to fatal and error events.
- INFO. Capture events that generate informational messages in addition to warning, error, and fatal events.
- DEBUG. Capture events that generate trace messages in addition to informational, warning, error, and fatal events.
- TRACE. Capture events that generate trace messages in addition to debug, informational, warning, error, and fatal events.
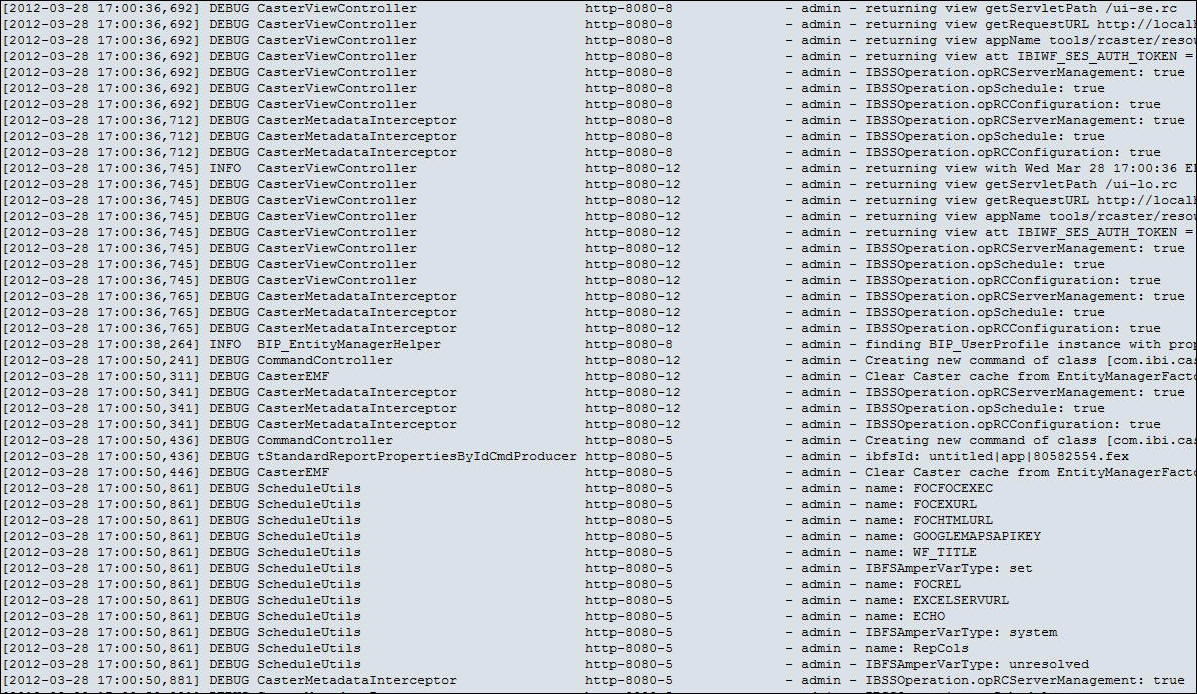
- Click the
log file for which you would like to view traces.
The following image shows an example where the event.log file is selected.
