If you have installed and configured your extension as described, your extension will be available for use in the WebFOCUS tools as a chart type in the Other format category under HTML5 Extension, as shown in the following image.
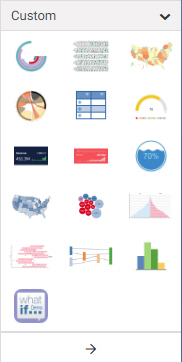
When creating a chart using WebFOCUS, chart extensions are available in the Custom category when you expand the content picker, as shown in the following image.
The attribute categories you defined in the dataBuckets object of your extension are available in the Query pane in InfoAssist or Display panel in WebFOCUS.
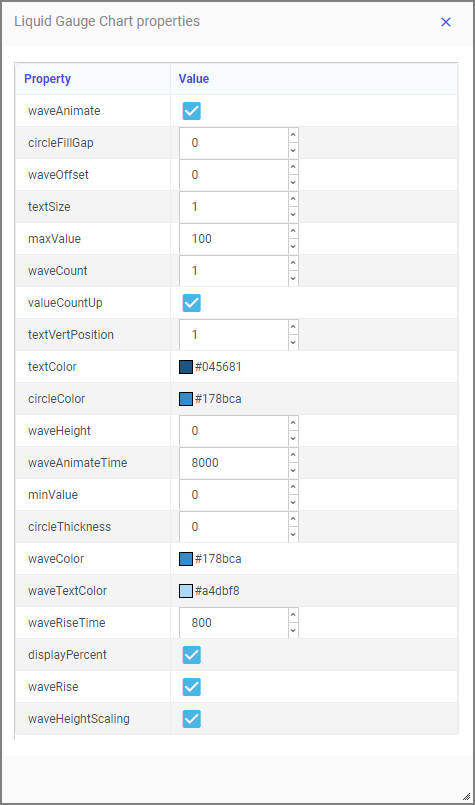
Additionally, in WebFOCUS, the properties defined in the propertyAnnotations object are available on the Format tab, in the Other section, when General is selected in the Quick Access menu. Clicking Extension properties opens the Extension properties panel, where you can make changes to the available properties, as shown in the following image, which shows properties for the liquid gauge chart extension.
The following syntax is added in the FOCEXEC:
- The LOOKGRAPH value is EXTENSION.
- The actual extension to use is identified in the chartType property
of the *GRAPH_JS block in the StyleSheet. For example, for a liquid gauge chart:
*GRAPH_JS chartType: "com.ibi.liquid_gauge", - Each custom attribute category name is prepended with a greater-than
character (>). For example, for a simple bar chart that has one label field and four value fields:
TYPE=DATA, COLUMN=N1, BUCKET= >labels, $
TYPE=DATA, COLUMN=N2, BUCKET= >value, $
TYPE=DATA, COLUMN=N3, BUCKET= >value, $
TYPE=DATA, COLUMN=N4, BUCKET= >value, $
TYPE=DATA, COLUMN=N5, BUCKET= >value, $
- Extension chart properties are listed under the extensions:extension_name object. For example, for a liquid gauge chart with the number of waves set to 3 and the wave color set to a shade of dark
blue, the properties appear as follows:
"extensions": {
    "com.ibi.liquid_gauge": {
        "waveCount": 3,
        "waveColor": "#083f9e"
    }
}
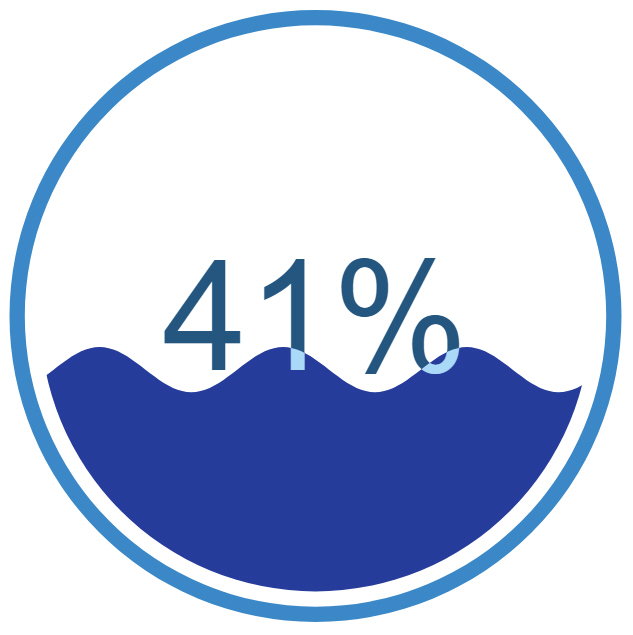
The following is a sample request using the liquid gauge extension.
GRAPH FILE wf_retail_lite
SUM PCT.WF_RETAIL_LITE.WF_RETAIL_SALES.QUANTITY_SOLD
BY WF_RETAIL_LITE.WF_RETAIL_GEOGRAPHY_CUSTOMER.BUSINESS_REGION
WHERE_GROUPED WF_RETAIL_LITE.WF_RETAIL_GEOGRAPHY_CUSTOMER.BUSINESS_REG
ION EQ 'North America'
ON GRAPH PCHOLD FORMAT JSCHART
ON GRAPH SET LOOKGRAPH EXTENSION
ON GRAPH SET AUTOFIT ON
ON GRAPH SET STYLE *
TYPE=DATA, COLUMN=N2, BUCKET= >value, $
*GRAPH_JS_FINAL
"chartType": "com.ibi.liquid_gauge",
"extensions": {
    "com.ibi.liquid_gauge": {
       "waveCount": 3,
       "waveColor": "#083f9e"
    }
}
*END
ENDSTYLE
END
Run the chart. The output is shown in the following image.