Inserting Components and Controls in a Document or In-Document Analytic Dashboard Using the Insert Tab
|
In this section: |
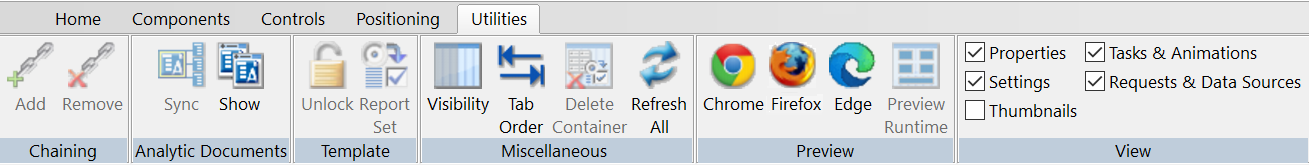
You can insert components and controls in a document or In-Document Analytic dashboard. The Insert tab contains the Components, Controls, and Pages groups, as shown in the following image.

Inserting Components in a Document or In-Document Analytic Dashboard Using the Components Group
|
How to: |
You can insert a report, chart, image, text, or line component in a document or In-Document Analytic dashboard. The Components group is shown in the following image.
The components are:
- Report
-
Inserts a report object. You can add reports to the Document canvas that appear when you run the layout. You can either embed or reference reports. Double-clicking a blank report object opens the Report canvas, where you can create and style a report to be used on the Document canvas.
You can also include parameters in a report. The values of the parameters can be assigned with controls that are added on the Document canvas.
- Chart
-
Inserts a chart object. You can add charts to the Document canvas that appear when you run the layout. You can either embed or reference charts. Double-clicking a blank chart object opens the Chart canvas, where you can create and style a chart to be used on the Document canvas.
Note:- HTML5 charts contain syntax that is currently not supported on the Document canvas, unless the output format is PDF Analytic Document or HTML Analytic Document.
- In the Workspaces area, when you reference or import an existing chart procedure, the Open File dialog box will only show charts that contain an output format of PDF Analytic Document or HTML Analytic Document.
- In the Data Servers area, when you reference or import an existing chart procedure, selecting an output format other than PDF Analytic Document or HTML Analytic Document may result in a not enough data to draw chart message.
- Image
-
Inserts an image. You can add an image, such as a company logo, to the layout.
You can insert an image into your document and add a hyperlink to it. After you run your document, and click the image, you can launch a URL, or run a report.
Note: An inserted image must be referenced from a specific directory location.
- Text
-
Inserts a text box. You can add text, such as headings, to your webpage. You can add directions or explanations for your reports and charts.
- Line
-
Inserts a line. You can add a horizontal or vertical line to distinguish between sections of your launch or display page.
Procedure: How to Format Text in a Document
You may apply various formatting and style options to words and individual text characters within the text object.
Note: Any formatting and styling that you may have applied to individual text strings within the text object will remain unchanged.
- On the
Insert tab, in the Components group, click Text.
The pointer changes to a crosshair.
- Drag your pointer across the canvas to create a text
object.
A text object with the default text, Enter text, is created.
- Highlight the text that you wish to format.
- Right-click the text, point to Style,
and then click Font.
The Font dialog box opens.
Note: You can also access font formatting options in the Properties panel.
- Select from the formatting options available. You can change the type, style, color, size, and effect of the font.
- Click OK to close the Font dialog box.
The formatting options that you selected applied to the text.
Procedure: How to Insert a Bulleted List or Numbered List Into a Text Element
To insert a bulleted list or numbered list into a text object:
- On the Insert tab, in the Components
group, click Text.
The pointer changes to a crosshair.
- Drag your pointer across the canvas to create a text
object.
A text object with the default text, Enter text, is created.
- Add multiple lines of text to the text object.
- Highlight and right-click the text that you want to include in the list.
- In the shortcut menu, select one of the following list
options:
- Bullets
- Disc
- Circle
- Square
- Numbering
- Numbers
- Lowercase Letters
- Uppercase Letters
- Small Roman numerals
- Large Roman numerals
Note:- Alternatively, you can select a bullet type before typing text to begin the list. Pressing enter will begin the next item in the list on a separate line.
- To change the bullet or number list type of an existing list, place your pointer on the list level you want to change and reselect a bullet or number list type. Selecting None will remove the bullets or numbers for that level and move any nested lists up one level. In order to switch between bullets and numbers, you must first remove the current list option by selecting None and then applying the list option you want.
- Bullets and numbering are not applied to documents using the DHTML output format.
- Bullets
Procedure: How to Insert Nested Lists Into a Text Element
To insert a nested list into the text object:
- On the Insert tab, in the Components
group, click Text.
The pointer changes to a crosshair.
- Drag your pointer across the canvas to create a text
object.
A text object with the default text, Enter text, is created.
- Add a list to the text object. For more information, see How to Insert a Bulleted List or Numbered List Into a Text Element.
- Place your pointer after a list item.
- Right-click, point to Nested List and
then select a bulleted or numbered list option.
A list is started within the current list, allowing you to enter text on that list level.
Note: Pressing tab while your pointer is on the same line as a list item will move that item one level down, resulting in a nested list. The bullet or number type selected is the next list type in the right-click shortcut menu. For example, if you have a bulleted list that uses the disc bullet type, pressing tab to move an item down one level will cause that nested list to have the circle bullet type.
You can continue to nest lists within other lists by using the same steps shown above.
Note: You cannot skip a list level. For example, in order to insert a nested bulleted list or nested numbered list on a lower level, there must be a list one level up from it.
Inserting Controls in an In-Document Analytic Dashboard Using the Controls Group
|
How to: |
You can insert an edit box, drop-down list, list box, radio button, or check box control in an In-Document Analytic dashboard. The Controls group is shown in the following image.
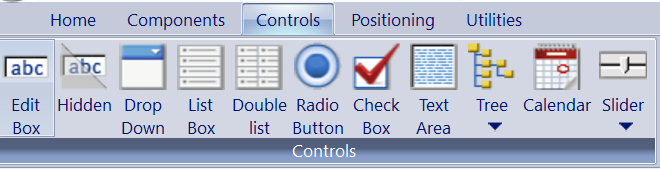
The controls are:
- Edit Box
-
Inserts a text box. You can enter a value in the text box.
- Drop Down
-
Inserts a drop-down list. A drop-down list enables you to select single or multiple values from a list of supplied values. In order to provide multiple values, the procedure must be set up to accept multiple values.
-
From a single-select list, you can select only one value each time a request is run.
-
From a multi-select list, you can select multiple values at once using the check boxes adjacent to the values.
You can use a dynamic or static list of values for the drop-down list.
-
- List Box
-
Inserts a list. You can select single or multiple values at one time from a list box:
-
From a single-select list, you can select only one value for each time a request is run.
-
From a multiselect list, you can select multiple values all at once by holding down the Ctrl key as you select values.
In order to provide multiple values, the procedure must be set up to accept multiple values.
List box values can be dynamic or static.
-
- Radio Button
-
Inserts a radio button. Using a radio button, you can only select a single value from a list of supplied values. Radio button values can be static or dynamic.
- Check Box
-
Inserts a check box into an HTML Analytic Document or PDF Analytic Document file. You can select multiple values from multiple check boxes.
Procedure: How to Change the Font Styling of In-Document Analytic Dashboard Controls
You can use the Styling: Font property in the Document canvas Properties panel to change the font used in an In-Document Analytic dashboard control.
- Create a new document, or open an existing document, using the HTML Analytic Document or PDF Analytic Document output format.
- Add content, such as a chart or report, to the document.
- On the Insert tab, in the Controls group, select a control type and add it to the page.
- Select the control and configure it using the Settings panel.
In the Settings panel, select a report and column from which to display values, then configure the filter properties and specify the target reports.
- Select the control and open the Properties panel.
- Click the ellipsis button next to the Styling: Font property.
The Font dialog box opens.
- Select the font styling properties that you wish to use in the control. You can change the font, font style, size, and color, and add an underline.
- Click OK to accept your changes.
- Click Run to load your document.
The text in the control uses the styling that you specified for it.
Adding Pages to a Document or In-Document Analytic Dashboard Using the Pages Group
You can add a new or existing page, or a Table of Contents, Page Master, or size and overflow page in a document or In-Document Analytic dashboard. The Pages group is shown in the following image.
The commands are:
- New
-
Inserts a new page to the Page Layout canvas. The new page appears below the current page and is named Page layout n, where n is a number that increments by 1.
Note:- You can also right-click the Page Layout canvas and select Insert new page after or Insert new page before to indicate where to include the new page.
- To delete a page, select the page in the Page Layout canvas and press the Delete key on the keyboard.
- Existing
-
Inserts an existing page. This page can contain images, drawing objects, text, page settings, reports, and charts.
To insert an existing page into your document, it must be saved as a procedure and exist somewhere in the WebFOCUS environment.
Note:- You can also right-click the Page Layout canvas and select Insert existing page after or Insert existing page before to indicate where to include the existing page.
- To delete a page, select the page in the Page Layout canvas and press the Delete key on the keyboard.
- Table of Contents
-
You can generate a Table of Contents page that shows a summary of the contents of the document, along with page numbers, and that can be printed with the document.
The entries can link to any component of the compound output (page, report, or graph) and vertical sort field values (BY field values) within each component report. The entries in the Table of Contents enable you to easily navigate to a particular section while viewing the document online.
When creating a compound layout report or a coordinated compound report, you can enable bookmarks available in Adobe® Acrobat® for PDF formatted reports. Bookmarking uses the Table of Contents descriptions, and the Table of Contents page and levels, to show specific reference points in the compound document.
Note: You cannot add a report, chart, image, text, or line object to the Table of Contents page. These commands are disabled when the Table of Contents is selected.
- Master
-
Inserts a Page Master. A Page Master is a page that can be added in the Design View where you can add and edit repeating elements, such as the company logo, or page numbers. Any element placed on the Page Master repeats on every page in the resulting report.
Note: You cannot add a report or chart to the Page Master. These options are disabled when the Page Master is selected.
- Overflow
-
Sets the size and overflow of a report object at run time.
You can control the overflow and relative (vertical) positioning of reports and graphs in coordinated compound documents so that reports fill the entire page, as well as maintain their relative position in the document.
Overflow is defined as the area of a report that exceeds its defined space in the page layout. For example, a multi-page report and a graph can both be added to a single page layout with the graph positioned beneath the report.
The report can flow or fill the page and the graph can be relatively positioned to the report, so it is placed at the end of the document following the complete rendering of the report.
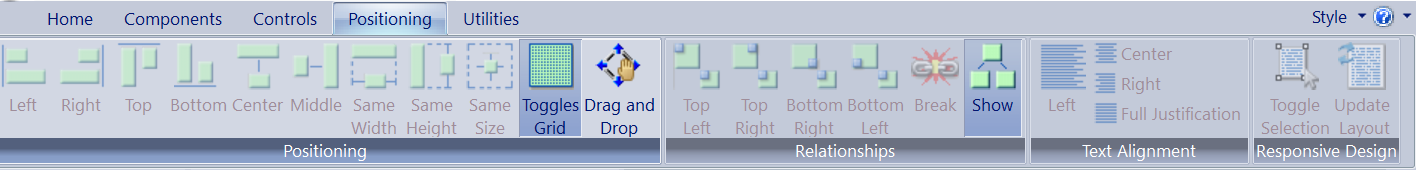
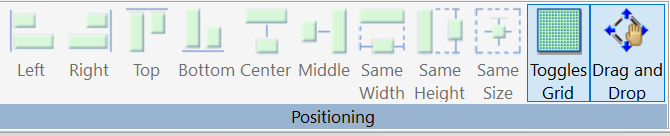
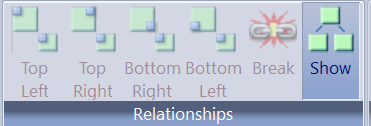
Overflow and positioning options are available from the Properties window and from the Positioning toolbar.
- Add Dashboard Bar
-
Inserts a Dashboard Bar into an In-Document Analytic dashboard. A Dashboard Bar is an additional page layout where you can insert controls, reports, and charts that display above the dashboard tabs.
The Dashboard Bar is only available for the HTML Analytic Document formatted documents. A Dashboard Bar can be a maximum of one page.
You can insert a Dashboard Bar into PDF Analytic Document formatted documents. However, if you run these documents, an empty page is returned.
Procedure: How to Create a Table of Contents Page
- Create a new document, or open an existing document.
- From the Insert tab, in the Pages group, click Table
of Contents.
The Table of Contents page appears in the document.
Table of Contents is the default title for the page. To edit the title, select the current title and type your new title.
To style the title, select the text, right-click it, and in the shortcut menu that opens, point to Style, and select from among the following options: Bold, Italic, Underline, or Superscript.
In addition, you can select Font to open the Font dialog box, where you can set the font, font style, font size, font color, and font effects.
Note: The text does not wrap and must fit within the width of the overall text element.
- Click Run to load your document.
The Table of Contents appears as the first page in your output.
- Click a hypertext link on the Table of Contents page to jump to that section within the document.
Procedure: How to Control Which Objects Appear in the Table of Contents
Note: The objects that appear in the Table of Contents depend on whether the document is coordinated or uncoordinated. By default, all report, chart, and page layout objects appear in the Table of Contents for uncoordinated documents.
To control which objects appear in the Table of Contents:
- Select a report, chart, or page layout object.
Each object has a TOC description, TOC level option, and TOC Number of sort levels in the Properties panel.
- To change the name of the description for the object,
type over the TOC description in the Properties
panel.
This description appears in the Table of Contents at run time.
- To change the hierarchical order of how the object appears
in the Table of Contents, type a TOC level.
For example:
0 = the object is not shown in the Table of Contents.
1 = the object is shown as a first level item in the Table of Contents.
2 = the object is shown as a second level item in the Table of Contents.
Follow this sequence for additional levels.
These levels appear in the Table of Contents at run time.
- To change the number of vertical sort fields (TOC levels)
that appear in the Table of Contents for the component, use the
up or down arrow to adjust TOC Number of sort levels in
the Properties panel. If the value designated is greater than the
count of BY fields in the component report, then the value defaults
to the total count of available BY fields.
Note: Coordinated reports do not support TOC Number of sort levels within a compound TOC. Those entries are ignored for coordinated reports.
- Run the procedure to see the updated TOC description and TOC levels.
Procedure: How to Use Bookmarks
- Create a compound layout that is made up of multiple reports and/or charts.
- Use the Properties panel to select each report/chart,
and enter a bookmark (Table of Contents) description, or use the
default selections.
Note: The Table of Contents page might or might not be included in the compound document, however, the descriptions and levels that appear as bookmarks are set through these options.
- In the Properties panel, from the Properties list, select Compound document.
- From the Bookmarking drop-down list, select On.
Note: Bookmarking is off by default.
- Click Run to load your document.
The bookmark tab is expanded in the PDF output.
- Click a bookmark link to jump to that section within
the document.
Note: You can use the shortcut menu to change the bookmark properties.
Procedure: How to Create a Page Master
- Create a new
document, or open an existing document.
The document opens on the Document canvas.
- From the Insert tab, in the Pages group, click Master.
The Page Master is added to the document.
- Add components (text, images, lines) and set their properties
on the Page Master.
Note: Only text, images, and lines can be added to the Page Master.
- Click Save to save your new Page Master or to save your changes to an existing Page Master.
Procedure: How to Use an Existing Page Master in Another Document
- Create a new document, or open an existing document.
- From the Insert menu, in the Pages group, click Existing.
The Open dialog box opens.
- Select the procedure file (.fex) that contains the Page Master.
- Click OK.
If a Page Master has already been added to the document, a message appears stating that a Page Master already exists in the current layout. You can respond in one of the following ways:
- Click Yes to replace the existing Page Master with the new one.
- Click No to merge the two Page Masters.
- Click Cancel to use the existing Page Master, instead of the Page Master from the Page Layout template.
- Save the document.
Procedure: How to Customize the Overflow for a Fixed Report
- Select an object from the Design View.
The Properties panel shows the available properties for the selected object.
- Select Fixed from the Size and
Overflow drop-down list.
Note: Fixed is the default selection. If Not Set is selected, Fixed is used as the default.
- Right-click the fixed report in the Design View and select Customize
Fixed Overflow.
The overflow page is added after the page layout in the Design View, displaying a copy of the fixed component (with the original size and position) from the page layout. Scroll down in the Design View until you see the overflow page.
- Resize the report to fill the page. You can also reposition the report overflow.
- Run the report.
Note: If the document contains multiple fixed reports, the report output maintains the same size and position as the report objects on the Document canvas.
Procedure: How to Set the Flowing Report Property
- Select an object from the Design View.
The Properties panel shows the available properties for the selected object.
- Click Flowing from the Size and
Overflow drop-down list.
Note: Repeat this step for any surrounding report objects to prevent the overlapping of reports and charts at run time.
Tip: When set to Flowing, flow margins are available for the page layout. These margins further enable you to adjust the page so that the report fills each page between the flow margins.
- Run the document.Note:
- If the document contains multiple flowing reports, the reports might overlap at run time. If you want one report to run until completion before the next report begins, you must set the relationship between the reports.
- If the document contains a flowing report and a chart, the chart might overlap the report at run time. If you want the report to run until completion before the chart begins, you must set the relationship between the chart and the report.
Procedure: How to Set Flow Margins for the Page Layout
When using Flowing overflow, each page layout has flow margins. Flow margins are set through the top and bottom margins. Flowing reports utilize flow margins to ensure that all reports fill the page, or the selected portion of the page, and that the header and footer information is preserved in the output.
Note: Flow margins are not available for Fixed overflow.
To set flow margins for the page layout:
- On the Document canvas, select a page layout from
the Design View.
Note: Ensure that the report object is set to Flowing overflow.
- From the Properties panel, type a value for the flow
margin: bottom property.
The flow margin bottom value sets the ending vertical coordinate where a flowing report ends on each page.
- From the Properties panel, type a value for the flow
margin: top property.
The flow margin top value sets the beginning vertical coordinate where a flowing report starts on each new page.
Note: When flow margins are changed from the default value, you can see the flow margins in the Design View of the Document canvas.
- Adjust the objects in the Design View between the flow
margins and run the report.
The report fills each page between the flow margins until it reaches the end.
Procedure: How to Add a New Overflow Page to a Page Layout
Each page layout works independent of any other page layout in the coordinated compound document. This enables you to add a new header and footer for each individual page layout and associated overflow pages. The following procedure describes how to add a new overflow page from the page layout.
You can use any of the following methods to create an overflow page.
- From a fixed report component in a
coordinated compound document.
Select the report component on the page and from the shortcut menu, right-click and select Customize Fixed Overflow.
The overflow page, displaying a copy of the fixed component (with the original size and position) from the page layout, is added after the page layout in Design View. This enables you to move and resize the overflow object and add reports and charts (as header and footer information) around the overflowing object.
- On a page layout with a fixed or flowing report.
From the New Page Layout drop-down list, select Add New Overflow Page.
- Click anywhere on the page layout, right-click and, from the shortcut menu, select Add New Overflow Page.
The overflow page is added after the page layout in the Design View. You can add reports and charts to the overflow page.
Note: If there is a flowing report component, any flow margins defined on the page layout will also appear on the overflow page. This enables you to move and resize the flow margins and add reports and charts (as header and footer information) around the flow margins.
The overflow page is identified as Page layout n, overflow object, where n is the number of the corresponding page layout.
Procedure: How to Add Header and Footer Information to the Overflow Page
You can add report and chart components on the overflow page as header and footer information for the overflow data, and position and size the components. You can copy existing components from the page layout, or add new report and chart components. All components added to the overflow page are automatically assigned as fixed components on the overflow page.
Note: The report and chart components added as headers and footers should not generate additional overflow.
- To copy an existing report or chart component
from the page layout:
- Select the component from the original page layout, right-click, and select Copy.
- Select Page layout n, overflow object from
the Properties panel list, or scroll down in the Design View until
you see the overflow page.
The overflow page appears in the layout.
- Right-click the current page and click Paste.
The component is copied to the overflow page, maintaining the size and position from the page layout.
Note: If the component was flowing on the original page layout, it is automatically changed to a fixed object on the overflow page.
- To add a new report or chart component to the overflow
page:
- From the Properties panel list, select Page
layout n overflow object.
The overflow page appears in the layout.
- Right-click the current page and select New Report or New
Graph.
Note: You can also add these components through the Insert tab.
The pointer changes into a crosshair.
- Drag the crosshair to create a report object or a chart object, and adjust it to the size you want.
- Open, import, or reference report or chart information as usual. This behavior is identical to adding a report or chart on the page layout.
Note: Keep in mind that these objects are acting as header and footer information, so they should not generate additional overflow.
- From the Properties panel list, select Page
layout n overflow object.
- To edit the report or chart component on the overflow page, double-click the object to open the associated tool and apply any styling or data changes.
Procedure: How to Insert a Dashboard Bar Into the Layout
- Create a new In-Document Analytic dashboard, or open
an existing In-Document Analytic dashboard.
The In-Document Analytic dashboard opens in Document canvas.
- From the Insert tab, in the Pages group, click Add Dashboard
Bar.
The Dashboard Bar is inserted at the top of the document.
You can insert controls, reports, and charts to appear in the Dashboard Bar above the dashboard tabs.
Note: Though the Dashboard Bar can be a full page, it is not recommended that you insert large reports and charts, as this would make the Dashboard Bar appear to be the same size, or larger, than the dashboard.