The visualizations available in a map layer depend on the layer type.
The following image shows the Layer Visualizations section of the ESRI Object Settings panel.
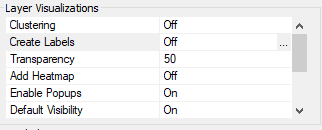
A list of layer visualizations you can configure in the Layer Visualizations section of the ESRI Object Settings dialog box follows.
- Clustering
-
Description. Enables clustering (grouping of symbols) on the selected layer.
Type of Field. Boolean.
Populated by. User.
Limits. On/Off. Default is Off. If you click this property, a dialog box opens that lets you turn on clustering and style the clusters. For information, see Configuring Layer Visualizations .
Example. On
- Create Labels
-
Description. Creates labels based on field values for point of interest layers.
Type of Field. Boolean.
Populated by. User.
Limits. On/Off. Default is Off. If you click this property, a dialog box opens that lets you configure labels. For information, see Configuring Layer Visualizations.
Example. On
- Transparency
-
Description. Transparency of the layer.
Type of Field. Numeric.
Populated by. User.
Limits. Values 0 - 100. 100 is 100% opaque, and 0 is 100% transparent. Default is 50.
Example. 50
- Add Heatmap
-
Description. Applies to Point of Interest and Cities geographic roles. Colors the areas around the points using a gradient in which the intensity of the color is based on the concentration of points.
Type of Field. Boolean.
Populated by. User.
Limits. On/Off. Default is Off.
Example. Off
- Enable Popups
-
Description. Shows an InfoWindow with the values of the layer attribute fields when a polygon or point is clicked.
Type of Field. Boolean.
Populated by. User.
Limits. On/Off. Default is Off.
Example. Off
- Default Visibility
-
Description. Makes the layer initially visible or not visible.
Type of Field. Boolean.
Populated by. User.
Limits. On/Off. Default is On.
Example. On
- Default Extent
-
Description. If Default Extent is Off, the map view is the extent of the first layer loaded. If it is On, the map view is the full layer. The map extent is determined as follows:
- If there are no layers, the extent is the entire map.
- If any layer is configured with the default extent, the extent is determined by that layer data.
- If there are one or more layers and no layer is configured with the default extent, the extent is determined by the data for the first layer.
Type of Field. Boolean.
Populated by. User.
Limits. On/Off. Default is Off.
Example. Off
- Spatial Coordinate System
-
Description. Is the id of coordinate system used by the WebFOCUS procedure to provide geographic data. For information about coordinate systems available with Esri, see https://developers.arcgis.com/javascript/jshelp/ref_coordsystems.html.
Note: For any Spatial Coordinate System under Layer Settings other than 4326, please use an internally hosted Geometry Service. This will require projection on the fly. For more details about Geometry Service please see http://server.arcgis.com/en/server/latest/publish-services/linux/about-the-geometry-service.htm.
Type of Field. ID.
Populated by. User.
Limits. Default option is decimal degrees (id=4326).
Example. 4326
Example: Enabling and Styling Clusters on Point Maps
Turning the Clustering layer visualization on for a point map combines multiple points into one symbol, with default class breaks, colors, and sizes. You can style the clusters by changing the default colors, sizes, and class breaks. The only symbol shape supported for clustering is a circle.
The default clusters are broken into three classes.
- Class 1 clusters 0 to 10 points using a 20px diameter symbol with blue fill.
- Class 2 clusters 11 to 200 points using a 35px diameter symbol with green fill.
- Class 3 clusters more than 200 points using a 60px diameter symbol with red fill.
The clusters change as you zoom the map.
When you turn the Clustering layer visualization on in the Settings panel for a map, a dialog box opens that enables you to customize the number of classes and the colors and sizes for each class, as shown in the following image.
To customize the symbols, enter the following information in the Cluster Settings dialog box.
- Click On in the Clustering section.
- Select a number of classes, between 2 and 5, from the Number of Classes drop-down list.
The class numbers are added to the list box on the left of the dialog box, as shown in the following image, where the number 3 was selected.
- Click each class number. The following properties become active for each class.
- Minimum. Specifies the smallest number of features (records) at any given map scale. Enter the smallest number of points you want to include in this class.
- Maximum. Specifies the largest number of features (records) at any given map
scale.
Enter the largest number of points you want to include in this class.
Note: The minimum value for each class must be less than its maximum value.
- Size. Represents the maximum symbol size (in pixels) that corresponds to this scale. Enter the maximum symbol size you want to use for this class.
- Color. Represents the color that will be used for coloring the inner circle. Click this box to open the color picker dialog box and select a color.
- Outline Color. Represents the color that will be used for coloring the outer circle. Click this box to open the color picker dialog box and select a color.
- Outline Width. Represents the width of the outer circle in pixels. Enter a number of pixels in this text box.
- Click OK.
Create an HTML page with an Esri component. Add the following request, named customer_locations.fex, in the folder with the HTML page, then add it to the HTML page using the Requests & Data Sources panel.
TABLE FILE WF_RETAIL_LITE
PRINT
ID_CUSTOMER
COGS_US
QUANTITY_SOLD
COMPUTE LONGITUDE/D12.2 =CUSTOMER_LONGITUDE;
COMPUTE LATITUDE/D12.2 = CUSTOMER_LATITUDE;
BY STATE_PROV_NAME
BY ID_CUSTOMER NOPRINT
WHERE COUNTRY_NAME EQ 'United States';
ON TABLE NOTOTAL
ON TABLE PCHOLD FORMAT XML
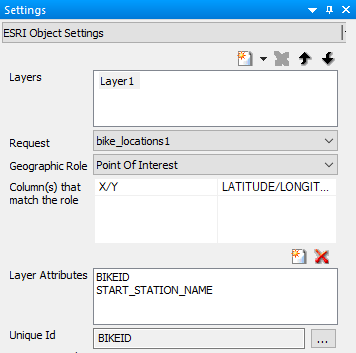
ENDIn the Settings panel, select this request, select the Point of Interest Geographic Role, and select ID_CUSTOMER as the Unique Id field, as shown in the following image.
In the Layer Visualizations section of the Settings panel, click Clustering. Click the On radio button.
Click OK and run the HTML page. The clusters appear with the default properties, as shown in the following image.
In the Layer Visualizations section of the Settings panel, click Clustering.
In the Cluster Settings dialog box, turn clustering on and select three classes. Select the options shown in the following images for each class.
Class 1
Class 2
Class 3
Click OK and run the HTML page. The customized clusters are shown in the following image.
Example: Adding Labels to Point of Interest Layers
When you generate a point layer on an Esri map, you can add a Labels visualization to display a field value at each point location.
The Layer Visualizations section of the Settings panel for an Esri map component is shown in the following image.
By default, Create Labels is set to Off. Click the ellipsis (...) next to Off to open the Labels dialog box, as shown in the following image.
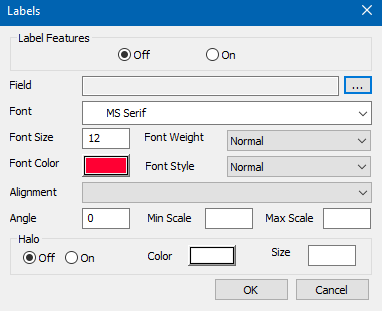
Click the On radio button and configure the following label properties.
- Field. Click the ellipsis (...) to select a field whose value will display for each point.
- Font. Select a font family from the Font drop-down list. The default font family is MS Serif.
- Font Size. Enter a point size for the font, or accept the default size (12 points).
- Font Weight. Select a font weight from the Font Weight drop-down list. Possible values are Bold, Bolder, Lighter, or Normal. The default value is Normal.
- Font Color. Click the Font Color field to open a color picker, or accept the default color (Red).
- Font Style. Select a font style from the Font Style drop-down list. Possible values are Italic, Normal, or Oblique. The default value is Normal.
- Alignment. Select an alignment for the labels relative to the point locations, from the Alignment drop-down list. Possible values are Above Center, Above Left, Above Right, Below Center, Below Left, Below Right, Center Center, Center Left, Center Right.
- Angle. Enter an angle in degrees for the orientation of the labels. The default value is 0 (zero).
- Min Scale. Enter the minimum map scale for which the labels should display, or leave this field blank for no minimum.
- Max Scale. Enter the maximum map scale for which the labels should display, or leave this field blank for no maximum.
- Halo. These fields define the properties of a color line around the font.
- Off/On. Click the On radio button to turn on halos.
- Color. Click the color field to open a color picker for selecting the halo color.
- Size. Enter a size in pixels for the thickness of the halo. The default value is 1.
The following request, bike_locations1.fex, provides point locations based on the start station latitudes and longitudes for bicycle trips.
DEFINE FILE ESRI_CITIBIKE
GENDER1/A10 = IF GENDER EQ 0 THEN 'None' ELSE IF GENDER EQ 1 THEN 'Male' ELSE 'Female';
LATITUDE/D20.8 = START_STATION_LATITUDE;
LONGITUDE/D20.8 = START_STATION_LONGITUDE;
END
TABLE FILE ESRI_CITIBIKE
PRINT START_STATION_NAME GENDER1
LATITUDE LONGITUDE
BY BIKEID
ON TABLE PCHOLD FORMAT XML
END
The HTML page has an Esri component that uses this request to generate a point of interest layer, as shown in the following image.
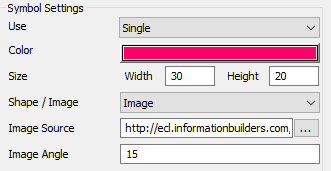
The symbol used for the point locations is a bicycle image (at URL https://ecl.informationbuilders.com/jschart/bicycle.png) angled at 15 degrees, as shown in the following image.
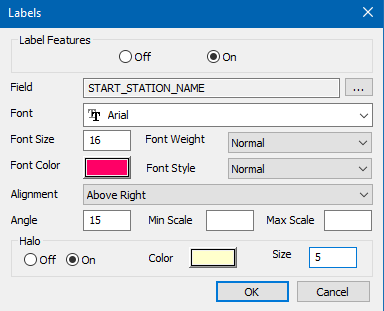
The labels are turned on and set to use the value of the field START_STATION_NAME as the label text for each point. The labels are displayed at a 15-degree angle, above and to the right of the point symbols. The font is red 16-point Arial. The halo is turned on. Its color is yellow and its size is 5. The Labels dialog box with these properties set is shown in the following image.
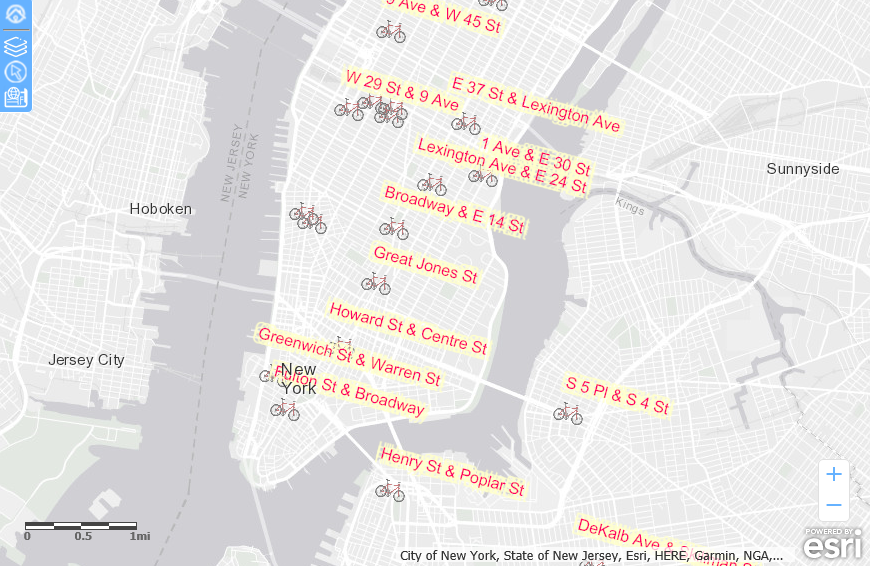
Run the HTML page. The output is shown in the following image.
Example: Enabling Popups
When you enable popups in the Layer Visualizations section of the ESRI Object Settings panel, and you click a marker or polygon, an InfoWindow opens that shows additional information for the map layer drawn. This popup is dependent on the layer attributes enabled at design time.
The following image shows an InfoWindow for a marker on the map layer:
Note: In order to display customized names rather than field names in the popup, the custom names must be defined with the TITLE attribute in the Master File. Using an AS name in the request to create a custom name is not supported in the infowindow.
To close the InfoWindow, click the X in the header or click another marker.
Clicking Zoom to zooms in the map to the location of the clicked marker.
Example: Enabling the Default Extent
With the Default Extent visualization Off (the default), the initial view of the layer shows the map view of the data layer defined. If there are multiple data layers, only one layer can have the Default Extent turned on. In this case, the map view will be determined by the map layer that has the Default Extent turned on. If no layer has Default Extent turned on, the extent of the first data layer defined for the map will be used.
The following image shows a map that has two layers, one based on countries, and one based on US states, as shown in the following image.
Running the HTML page shows both layers, with the default extent set by the Countries layer, as shown in the following image.
The following image shows the States map layer with the Default Extent turned on.
The following image shows that the map now zooms to the default extent of the States map layer.
If you have zoomed the map using the zoom controls, you can return to the default extent using the Default Extent control, shown in the following image.

For any layer, you can zoom to the layer extent using the Table of Contents control, shown in the following image.