Configuring Symbology for a Point Data Layer

In this section:

Geographical point data places markers on the map layer that can be configured with a wide range of shape, size, color, and image options.

The following image shows the Symbol Settings section of the ESRI Object Settings panel for a point-based data layer. Some selections may open additional options not shown in this image.

The following table summarizes the types of symbology available for a point layer. Each type of symbology is illustrated in one of the sections that follows.

Type of Symbol

(Subtype)

Description

Configuration Fields

Single

(Shape)

User selects from a list of marker shapes.

Use. Selects the type of symbols, Single for this option.

Color. User selects a marker color. The default is red.

Size. User specifies the marker size in pixels. The default is 12 and the maximum is 99.

Shape/Image. Select Shape for this option.

Shape. User selects one of the following marker shapes:

  • Circle (default)
  • Cross
  • Diamond
  • Square
  • X

Outline Color. User selects a color for the marker border, when the marker is a standard shape. The default is gray85.

Outline Thickness. Is the thickness of the outline in pixels. The default value is 1.

Outline Style. User selects one of the following styles for the marker border. Solid (default), Dashes, Dash-dot, Dash-dot-dot, Dots, Long dashes, Long dash-dot, None, Short dashes, Short dash-dot, Short dash-dot-dot, Short dots.

For more information, see Configuring Point Symbology Using a Single Standard Shape.

Single

(Image)

User provides an image source for the markers.

Use. Selects the type of symbols, Single for this option.

Color. N/A. The image has its own colors.

Size. User specifies the marker width and height in pixels. The default is 12 for each, and the maximum is 99.

Shape/Image. Select Image for this option.

Image Source. User must provide the path to the image.

Image Angle. User can enter an angle, in degrees, to control the image orientation.

For more information, see Configuring Point Symbology Using a Single Image File.

Color

User specifies a field to be used to classify marker colors.

Use. Selects the type of symbols, Color for this option.

Using Field. User selects a field in the request to be used to classify the markers by color.

By. User selects from the following classification methods.

  • Natural Jenks (the default).
  • Quantile.
  • Equal Breaks.
  • Standard Deviation.
  • Geometrical Breaks.

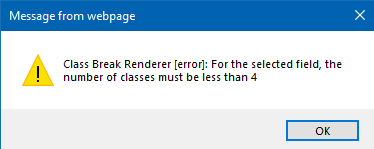
Number of Classes. User specifies the number of color breaks. The default is 5.

Color Scheme. User selects the color palette for the markers. The default uses shades of green.

For more information, see Configuring Point Symbology Using Color.

Size

User specifies a field to be used to size the markers.

Use. Selects the type of symbols, Size for this option.

Using Field. User selects a field in the request to be used to classify the markers by size.

Color. User selects a color for the markers.

For more information, see Configuring Point Symbology Using Size.

Dynamic

The WebFOCUS request that provides the location dimension defines the marker properties.

Use. Selects the type of symbols, Dynamic for this option.

Label. User specifies a field in the request that contains the label text for the legend. The default is the AS name, title, or field name.

Color. User specifies a field in the request that defines the colors for the markers. Not supported when marker images are used, as each image has its own colors.

Size. User specifies a field in the request that defines the size in pixels for the markers. The default is 12 and the maximum is 99.

Image Source. User specifies a field in the request that contains the path to the marker images.

For more information, see Configuring Dynamic Point Symbology.

Unique

User selects marker properties for each value of a dimension in the request.

Use. Selects the type of symbols, Unique for this option.

Using Field. User selects an alphanumeric dimension in the request and assigns marker properties for each value.

Size. User specifies a size in pixels for the markers, for a standard shape. For an image, the user specifies the width and height in pixels. The default is 12 and the maximum is 99.

Shape / Image. User can select a standard shape or specify an image source for the markers.

Dimension Values box. A box is populated with the dimension values. The user can select values and move them to the right, then assign marker properties to those selected values.

Label. User specifies text to display in the legend for each selected dimension value.

Color. If Single is the selected marker type, the user selects a color for each selected dimension value.

Shape. If Shape is the selected marker type, the user selects a standard shape and standard shape properties for each selected dimension value.

Image Source. If Image is the selected marker type, the user specifies an image source for each selected dimension value.

For more information, see Configuring Unique Symbology for Points.

Note: The symbol dynamically changes size with the zoom level of the map output for a single symbol, but not for a symbol that is unique, dynamic, based on size, or based on color.

Configuring Point Symbology Using a Single Standard Shape

The default symbol used for points is a 12-pixel red circle with a solid border, as shown in the following image.

You can open a color picker dialog box by clicking the Color field, can enter a size in pixels, and select a different shape (square, diamond, cross, or X). The maximum size supported is 99. For the outline, you can open a color picker dialog box by clicking the Outline Color field, enter a thickness in pixels, and select an outline line style. the outline styles are:

Example: Configuring Point Symbology Using a Standard Shape

This example uses a blue diamond symbol with a 3-pixel wide black solid outline as the marker. The following image shows the symbol settings. The external WebFOCUS request used to provide the point data is the customer_locations procedure created in Configuring a Map Layer. The geographic role is Point of Interest, and the fields that match the role are LATITUDE/LONGITUDE.

Run the HTML page. The output is shown in the following image.

Configuring Point Symbology Using a Single Image File

You can select a valid image file to use as the marker for point data and specify its size and orientation (image angle), as shown in the following image.

The default width and height are 12 pixels and the maximum number of pixels is 99.

Selecting a color has no effect on the output, as the image file is placed on the points with no manipulation, except for size.

The symbol can be located on your machine or at a URL reference.

Leaving the Image Angle field blank, or entering 0 (zero) or 360, displays the images at their default orientation.

Example: Configuring Point Symbology Using an Image File

The following example uses a US flag as the symbol for the Customer layer.

In the Symbol Settings section of the ESRI Object Settings panel, select Single in the Use drop-down list and Image in the Shape / Image drop-down list.

Enter the following URL in the Image Source box.

http://ecl.informationbuilders.com/jschart/us.gif

Run the HTML page. The output is shown in the following image.

Example: Changing the Orientation of a Point Image Using Single Image Symbology

The following request, bike_locations.fex, is used to generate a point of interest layer.

DEFINE FILE ESRI_CITIBIKE
GENDER1/A10 = IF GENDER EQ 0 THEN 'None' ELSE IF GENDER EQ 1 THEN 'Male' ELSE 'Female';
LATITUDE/D20.8 = START_STATION_LATITUDE;
LONGITUDE/D20.8 = START_STATION_LONGITUDE;
END
TABLE FILE ESRI_CITIBIKE
PRINT START_STATION_NAME  GENDER1
LATITUDE LONGITUDE
BY BIKEID
ON TABLE PCHOLD FORMAT XML
END

The HTML page has an Esri component that uses this request, as shown in the following image.

The symbol used to identify the point locations will be a bicycle image displayed at a 45 degree angle. The URL to the image is:

http://ecl.informationbuilders.com/jschart/bicycle.png

The symbol settings are shown in the following image.

Run the HTML page. The output is shown in the following image.

Configuring Point Symbology Using Color

When you select Color in the Symbol Settings Use drop-down list of the ESRI Object Settings panel, the markers are colored using a choice of color classification systems, as shown in the following image.


Symbol Settings showing Color options
Using Field

Description. This is a numeric field in the request whose values will be used by the classification schema to define the class breaks.

Type of field. Combo box.

Populated by. User.

User limitations. User can only select one field. It should be a measure field or numeric.

Number of Classes

Description. This is the number of class breaks that will be rendered.

Type of field. Combo box.

Populated by. User.

User limitations. User can only select values 2 through 9. The default is 5.

Note: The map will not render if the data cannot be divided into the number of classes selected. For example, if the data can only be divided into four classes, but five is selected, the map will not render, and a message similar to the one shown in the following image will be displayed.

By

Description. This is the classification scheme to be used for assigning the breaks and ranges.

Type of field. Drop-down list.

Populated by. User.

User limitations. Choices are:

  • Natural Jenks, a classification scheme that uses breaks inherent in the data, grouping similar values and maximizing differences between groups. This is the default choice.
  • Quantile, a classification scheme in which each class contains an equal number of points.
  • Equal Breaks, a classification scheme that breaks the data into equal ranges of values.
  • Standard Deviation, a classification scheme that defines the breaks based on the number of standard deviations from the mean.
  • Geometrical Breaks, a classification scheme that bases class breaks on intervals that have a geometrical series.
Color Scheme

Description. This lets you select an array of color values, defining the color ramp. The first color will be used to render the minimum data class, and the last color will be used to render the maximum data class.

Type of field. Drop-down list.

Populated by. User.

User limitations. User can only select one color array. The default array uses shades of off-white and green.

Example: Symbolizing Points Using Color

This example symbolizes the points using color. The external WebFOCUS request used to provide the point data is the customer_locations procedure created in Configuring a Map Layer. The geographic role is Point of Interest, and the fields that match the role are LATITUDE/LONGITUDE. This example uses the Natural Jenks color classification scheme based on the COGS_US field, as shown in the following image.


Symbol Settings using Color and the Natural Jenks scheme

Run the HTML page. The output is shown in the following image.

Configuring Point Symbology Using Size

When you choose Size in the Symbol Settings Use box in the ESRI Object Settings panel, each symbol is sized based on a numeric field in the request. You can also select a single color for the markers, as shown in the following image.


Example: Symbolizing Points Using Size

This example uses the COGS_US field to size the markers and blue to color the markers, as shown in the following image.

The WebFOCUS request that provides the values is customer_locations.fex, described in Configuring a Map Layer. Run the HTML page. The output is shown in the following image.

Configuring Dynamic Point Symbology

When the symbology for points is Dynamic, you can specify columns in the request that provide labels, colors, sizes, and image sources for the points, as shown in the following image.


Descriptions of the fields available when you select Dynamic in the Symbol Settings Use drop-down list follow.

Label

Description. This column will be used to provide the text in the Legend.

Type of field. Combo box.

Populated by. User.

User limitations. User can only select one column in the layer request.

Color

Description. This column will provide a value for the color of a marker. Any valid color value is accepted for example, RGB, hex, or named. The default is red.

Type of field. Combo box.

Populated by. User.

User limitations. User can only select one column in the layer request. Not supported when the markers are configured as images.

Size

Description. This column will provide a value for the size of a marker in pixels. The default is 12 and the maximum is 99.

Type of field. Combo box.

Populated by. User.

User limitations. User can only select one column in the layer request.

Image Source

Description. This column will provide a value for the image used as a marker. The value needs to be a qualified URL. If no image source is specified, the default marker is a circle.

Type of field. Combo box.

Populated by. User.

User limitations. User can only select one column in the layer request.

Once Image symbology is selected, color and size are disabled.

Note: You cannot type characters in the combo boxes for dynamic symbols. You can only select field names.

Example: Using Dynamic Symbols for Points

This example uses dynamic images, sizes, and labels for points.

You can create a request using the Report Canvas or by entering request syntax in the Text Editor. For information about creating a WebFOCUS report request using the Report Canvas, see Creating Reports in WebFOCUS App Studio.

The following WebFOCUS procedure dynamically defines fields that supply the labels, sizes, and images for the map points. Paste this procedure into the text editor and save it as customer_locations2.fex.

DEFINE FILE WF_RETAIL_LITE
SIZE1/I4 = IF COUNTRY_NAME EQ 'United States' THEN 25
            ELSE IF COUNTRY_NAME EQ 'France' THEN 20
            ELSE IF COUNTRY_NAME EQ 'Japan' THEN 12
            ELSE IF COUNTRY_NAME EQ 'Italy' THEN 15
            ELSE 10;
LABEL1/A20 = IF COUNTRY_NAME EQ 'United States' THEN 'US'
            ELSE IF COUNTRY_NAME EQ 'France' THEN 'France'
             ELSE IF COUNTRY_NAME EQ 'Japan' THEN 'Japan'
             ELSE IF COUNTRY_NAME EQ 'Italy' THEN 'Italy'
            ELSE 'UK';
IMAGE1/A80 = IF COUNTRY_NAME EQ 'United States' 
             THEN 'http://ecl.informationbuilders.com/jschart/us.gif'
             ELSE IF COUNTRY_NAME EQ 'France' 
             THEN 'http://ecl.informationbuilders.com/jschart/france.gif'
             ELSE IF COUNTRY_NAME EQ 'Japan' 
             THEN 'http://ecl.informationbuilders.com/jschart/japan.gif'
             ELSE IF COUNTRY_NAME EQ 'Italy' 
             THEN 'http://ecl.informationbuilders.com/jschart/italy.gif'
             ELSE 'http://ecl.informationbuilders.com/jschart/uk.gif';
END
TABLE FILE WF_RETAIL_LITE
SUM
     WF_RETAIL_LITE.WF_RETAIL_CUSTOMER.ID_CUSTOMER
     WF_RETAIL_LITE.WF_RETAIL_SALES.COGS_US
     QUANTITY_SOLD
     LABEL1 SIZE1 IMAGE1
     COMPUTE LONGITUDE/D12.2 = CUSTOMER_LONGITUDE;
     COMPUTE LATITUDE/D12.2 = CUSTOMER_LATITUDE;
BY COUNTRY_NAME
BY WF_RETAIL_LITE.WF_RETAIL_CUSTOMER.ID_CUSTOMER NOPRINT
WHERE COUNTRY_NAME EQ 'United States' OR 'France' OR 'Italy' OR 'Japan' OR 'United Kingdom';
ON TABLE NOTOTAL
ON TABLE PCHOLD FORMAT XML
END

Add this request to the HTML page using the Requests & Data Sources panel. Then configure the ESRI Object Settings panel to use this request for the Customer layer. Configure the symbol settings by selecting the appropriate fields from the request, as shown in the following image.


The output is shown in the following image, after zooming in to fill the frame. The Legend is toggled on to show the labels, sizes, and images used.

Configuring Unique Symbology for Points

When you configure Unique symbology, you can display a different shape or image for each value of an alphanumeric dimension field in the request.

The following image shows the Symbol Settings properties for Unique symbology in the ESRI Object Settings panel.

Descriptions of the fields for unique symbology for points follow.

Using Field

Description. Is an alphanumeric dimension field in the request whose values will determine the shape or image to use.

Type of field. Combo box.

Populated by. User.

User limitations. Must be an alphanumeric dimension field in the request.

Size

Description. Is the size of a marker in pixels for a standard shape. For an image, size consists of separate values for Width and Height. The default is 12 and the maximum is 99.

Type of field. Text box.

Populated by. User.

User limitations. Must be a measure field in the request.

Shape / Image

Description. Indicates which type of marker to use, a standard shape or an image file.

Type of field. Drop-down list.

Populated by. User.

User limitations. All values must use the same type of marker.

Values

Description. This is the list of values for the Using Field. You can select any value and click the arrow keys to move it between the original list box and the user-selected values list box. Any values not in the user-selected list will display with default markers.

Type of field. List box.

Populated by. System.

User limitations. The user can select values from the system-generated list.

Label

Description. For each value selected, you can enter a label to display in the legend.

Type of field. Text box.

Populated by. User.

User limitations. User can enter a single label for each value of the Using Field.

Color

Description. For each value selected, you can select a marker color. The default is red. Note that color is disabled if the type of marker is image.

Type of field. Color picker.

Populated by. User.

User limitations. User can select a single color for each value of the Using Field.

Shape

Description. For each value selected, you can select a standard shape and its properties (color, outline color, outline thickness, and outline style).

Type of field. Drop-down list.

Populated by. System defined.

User limitations. User can select a single shape and its properties for each value of the Using Field. Choices are:

Shape Values

  • Circle. This is the default shape.
  • Diamond.
  • Cross.
  • Square.
  • X.

Color. The default marker color is red.

Outline Color. The default outline color is gray85.

Outline Thickness. Is the thickness of the outline in pixels. The default value is 1.

Outline Style. Select one of the following outline styles.

  • Solid (default).
  • Dashes.
  • Dash-dot.
  • Dash-dot-dot.
  • Dots.
  • Long dashes.
  • Long dash-dot.
  • None.
  • Short dashes.
  • Short dash-dot.
  • Short dash-dot-dot.
  • Short dots.
Image Source

Description. For each value selected, specify an image file. This file must have a valid image format.

Type of field. Text box with Browse to button.

Populated by. User.

User limitations. User can specify a single image file for each value of the Using Field. It can be a path to a file accessible by the user PC or a URL reference. This file must have a valid image format.

Example: Configuring Unique Image Symbology for Points

This example configures a unique image for the markers for each country name.

Configure the map to use the customer_locations2 procedure and the Point of Interest geographic role in the ESRI Object Settings panel. Configure the unique symbology to use the COUNTRY_NAME field, as shown in the following image.

Move the values of the COUNTRY_NAME field to the right using the > arrow and configure them as follows.

For France, enter France in the Label box and enter the following in the Image Source box:

http://ecl.informationbuilders.com/jschart/france.gif

For Italy, enter Italy in the Label box and enter the following in the Image Source box:

http://ecl.informationbuilders.com/jschart/italy.gif

For Japan, enter Japan in the Label box and enter the following in the Image Source box:

http://ecl.informationbuilders.com/jschart/japan.gif

For the United Kingdom, enter UK in the Label box and enter the following in the Image Source box:

http://ecl.informationbuilders.com/jschart/uk.gif

For the United States, enter US in the Label box and enter the following in the Image Source box:

http://ecl.informationbuilders.com/jschart/us.gif

The output is shown in the following image, after zooming in to fill the frame. The Legend is toggled on to show the labels, sizes, and images used.