Link to Predefined Reports, Charts, and Visualizations Using Auto Linking
|
How to: |
Use the Auto Linking feature to connect a source procedure to one or more predefined target reports, charts, or visualizations. The links that enable these connections are created automatically by the Auto Linking feature.
The Auto Linking source/target relationship is structured as follows:
- Auto Linking Source Report. The source report has the Enable Auto Linking property set to Yes. Also, the source report contains one or more columns that correspond with parameters that can be passed to the target reports. For example, if the source report has a Product Category column, it can Auto Linking to target reports that have Product Category as a parameter.
- Auto Linking Target Reports. The target reports have both the Enable Auto Linking property, and the Auto Link Target property set to Yes. Also, they must have one or more parameters that correspond with columns in the source report.
Because Auto Linking reports, charts, and visualizations are manually tagged with the Auto Linking property values, you control the allowable drilldowns. This can prevent report users from drilling down too far and losing focus.
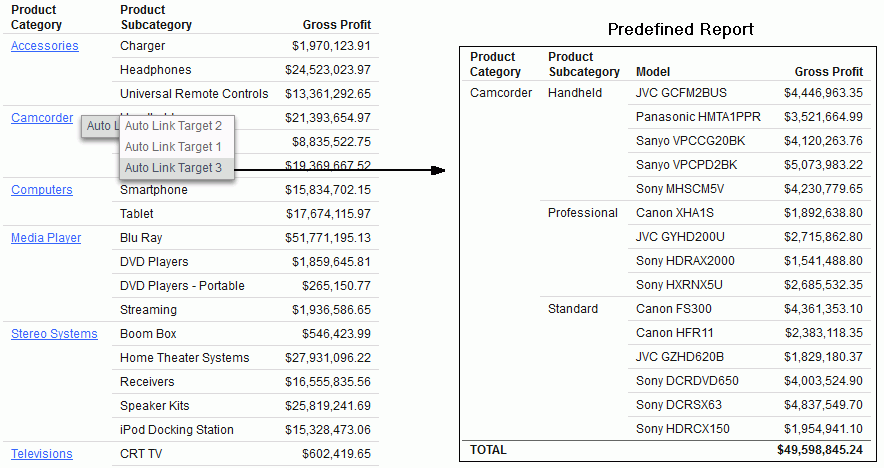
In the following image, the source report on the left shows all Product Categories. Since Auto Linking is enabled in the source, the Product Categories all appear as hyperlinks. The Auto Linking Target property has been set for 3 reports that all have filters for Product Category.
In the following example, the user clicked Camcorder and selected a drill-down report, shown on the right. The source passed the camcorder parameter to the predefined target report, which includes a WHERE filter for Product Category. The resulting drill-down report shows camcorder information only, down to the model level.

Once the target reports are tagged with the Auto Linking property values, they are eligible to be used as targets for other source reports in the domain that use the same parameter. They will automatically appear in the Auto Linking lists for those reports.
Procedure: How to Connect Reports, Charts, and Visualizations with Auto Linking
- Select a report, chart, or visualization that you wish to designate as a source. The source report must contain one or more
columns that correspond with parameters that can be passed to the target reports. In the File/Folder Properties panel, change
the Enable Auto Linking property to Yes.
Close the source.
- Select a report, chart, or visualization that you wish to designate as a target. The target report must have one or more
parameters that correspond with columns in the source report. In the File/Folder Properties panel, change the Enable Auto
Linking property to Yes and change the Auto Link Target property to Yes.
Close the target. Repeat this step for additional targets, as needed.
- Run the source report.
Hyperlinks automatically appear for columns that support Auto Linking. Click a hyperlink and select a target report from the context menu. Note that the resulting report opens in a new tab on your browser.
