Creating an Accordion By Row Report
|
How to: |
Accordion By Row reports are HTML reports that offer an interactive interface to data aggregated at multiple levels by presenting the sort fields within an expandable tree. By default, the report will present the highest dimension or sort field (BY value) and the aggregated measures associated with each value. The tree control can be used to open or close each dimension and view the associated aggregated values. Clicking the plus sign (+) next to a sort field value opens new rows that display the next lower level sort field values and subtotals. The lowest level sort field, when expanded, displays the aggregated data values.
Using the SET EXPANDBYROW or SET EXPANDBYROWTREE command with HTMLCSS ON enables any HTML report to be turned into an Accordion By Row request. EXPANDBYROW and EXPANDBYROWTREE automatically invoke the SET SUBTOTALS=ABOVE command, which moves the subtotal rows above the subheading and data rows. A SUB-TOTAL command is automatically added for the next-to-last BY field.
When an Accordion By Row report uses the PRINT command, the innermost level of the resulting tree contains detail records from the data source. There can be many detail records for each combination of BY fields, so it may be unclear what distinguishes the various detail records within the display. In order to make the report more useful, include at least one field in the report that can be used to distinguish between the detail level rows.
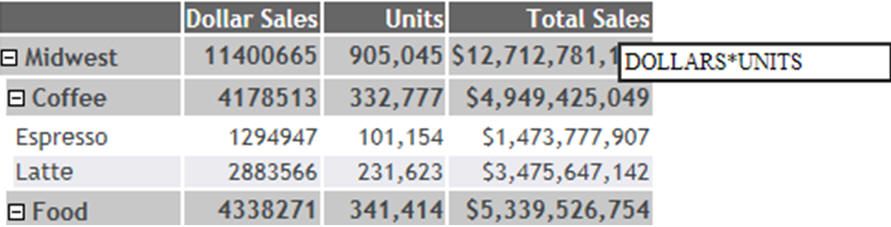
When an Accordion By Row report uses the SUM command, each row, even at the innermost level of the tree, is actually a subtotal row and is completely described by the combination of BY fields in the request. Each level will be presented at the aggregated level, and the data values will represent the aggregation of the lowest level BY.
Styling an Accordion By Row report can be done using standard HTML report techniques, but it is important to keep the report structure in mind. All rows, except the lowest level, are actually SUBTOTAL rows and the lowest level contains the report DATA.
Accordion By Row reports display the grand total row as an anchor row below the data. This anchor row displays above both the report and page footings aligned to the left margin of the report. To generate Accordion By Row reports without the grand total anchor row, add ON TABLE NOTOTAL to the request.
Using the Accordion By Row enhanced interface, navigation is easier when working with wide and large reports in a portal page, the data automatically resizes to fit the size of the container, and the column widths automatically adjust based on the largest data value or column title, whichever is larger. The SET EXPANDBYROWTREE=ON command in a procedure enables the enhanced Accordion by Row feature. The SET AUTOFIT ON command in a procedure automatically resizes the data to fit the size of the container. For more information on the enhanced interface, see Create an Accordion Report With the Enhanced Interface.
Accordion reports can also be created to be opened by column, instead of by row. See Create an Accordion Report With the Enhanced Interface for information on how to create Accordion reports using the SET EXPANDABLE command.
Syntax: How to Create Accordion Reports That Expand By Row
|
How to: |
SET EXPANDBYROW = {OFF|ON|n}ON TABLE SET EXPANDBYROW {OFF|ON|n}where:
- OFF
-
Does not create an Accordion report. OFF is the default value.
- ON
-
Creates an Accordion report, which initially displays only the highest sort field level. To see rows on lower levels, click the plus sign (+) next to one of the displayed sort field values.
- ALL
-
Creates an Accordion report in which all sort field levels are initially expanded. To roll up a sort field level, click the minus sign (-) next to one of the sort field values on that level.
- n
-
Creates an Accordion report in which n sort field levels are initially expanded. To roll up an expanded sort field level, click the minus sign (-) next to one of the sort field values on that level.
Note:- Accordion By Row reports require that the HTMLCSS parameter be set to ON.
- By default, a blank line is generated before a subtotal on the report output. You can eliminate these automatic blank lines by issuing the SET DROPBLNKLINE=ON command.
Example: Creating an Accordion By Row SUM Report
The following request against the GGSALES data source has four sort fields, REGION, ST, CATEGORY, and PRODUCT:
TABLE FILE GGSALES
SUM DOLLARS/D8MC
UNITS/D8C
BUDDOLLARS/D8MC BUDUNITS/D8C
BY REGION
BY ST
BY CATEGORY
BY PRODUCT
ON TABLE SET HTMLCSS ON
ON TABLE SET EXPANDBYROW ON
ON TABLE SET DROPBLNKLINE ON
ON TABLE PCHOLD FORMAT HTML
ON TABLE SET STYLE *
TYPE=REPORT,
    COLOR=RGB(66 70 73),
    FONT='TREBUCHET MS',
    SIZE=9,
    SQUEEZE=ON,
    GRID=OFF,
$
TYPE=REPORT,
    GRID=OFF,
    FONT='TREBUCHET MS',
    COLOR=RGB(52 85 64),
$
TYPE=TITLE,
COLOR='WHITE',
BACKCOLOR=RGB(52 85 64),
STYLE=-UNDERLINE,
$
TYPE=HEADING,
COLOR='WHITE',
BACKCOLOR=RGB(52 85 64),
$
TYPE=FOOTING,
COLOR='WHITE',
BACKCOLOR=RGB(52 85 64),
$
TYPE=SUBTOTAL,
BACKCOLOR=RGB(72 118 91),
$
TYPE=SUBTOTAL,
BY=1,
COLOR='WHITE',
$
TYPE=SUBTOTAL,
BY=2,
COLOR='WHITE',
BACKCOLOR=RGB(132 159 126),
$
TYPE=SUBTOTAL,
BY=3,
COLOR='WHITE',
BACKCOLOR=RGB(158 184 153),
$
TYPE=GRANDTOTAL,
COLOR='WHITE',
BACKCOLOR=RGB(52 85 64),
STYLE=BOLD,
$
ENDSTYLE
END
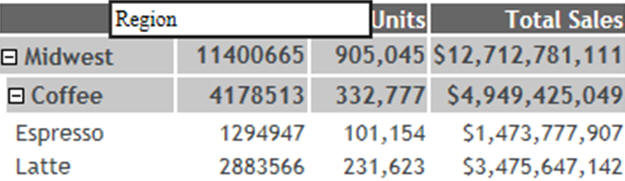
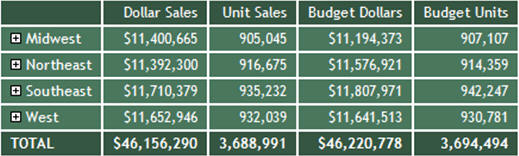
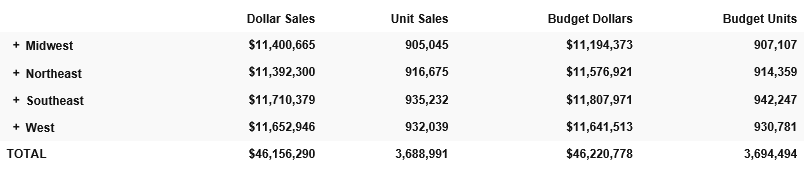
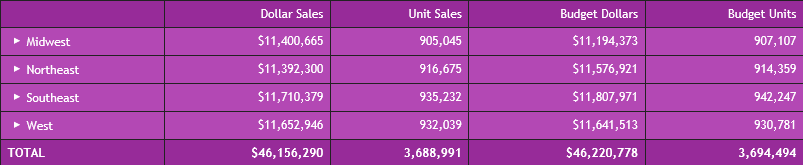
The initial output shows only the top level BY field (REGION), as shown in the following image.
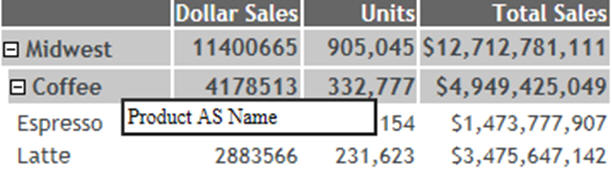
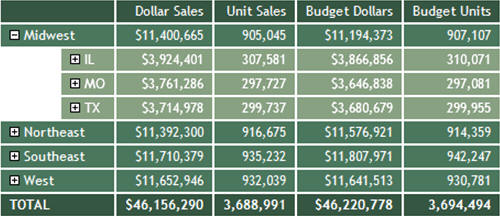
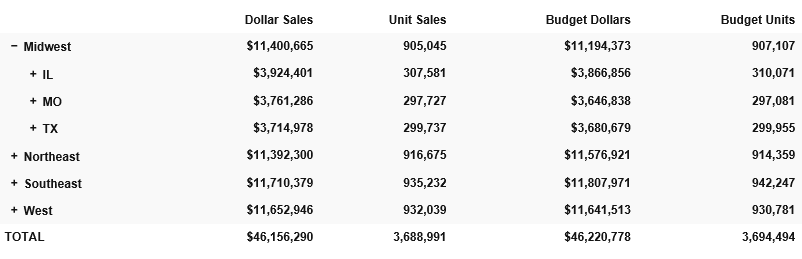
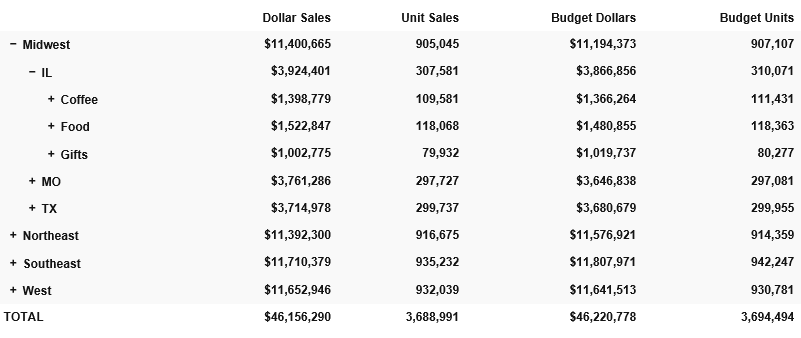
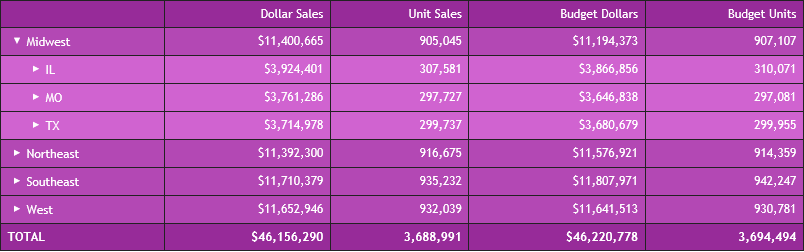
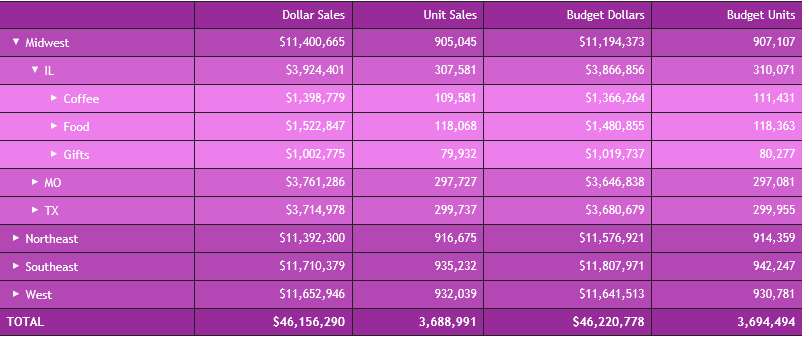
Clicking the plus sign (+) next to the Midwest region opens the rows that show the states associated with that region, as shown in the following image.
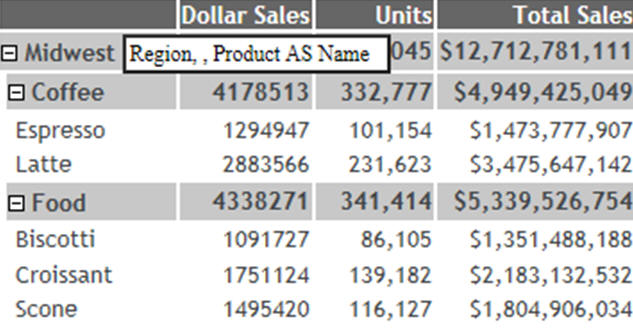
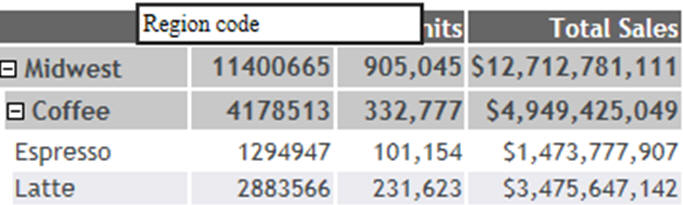
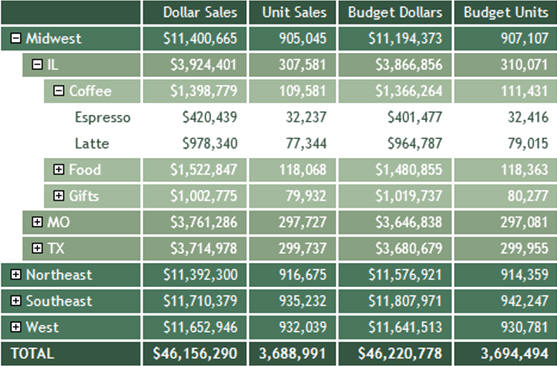
Clicking the plus sign (+) next to the state IL opens the rows that show the categories associated with that state, as shown in the following image.
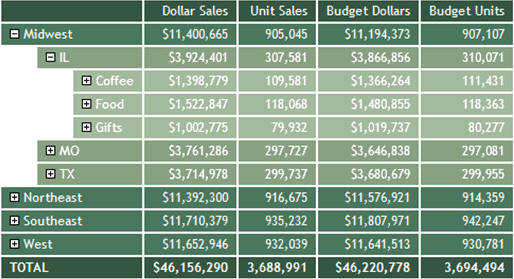
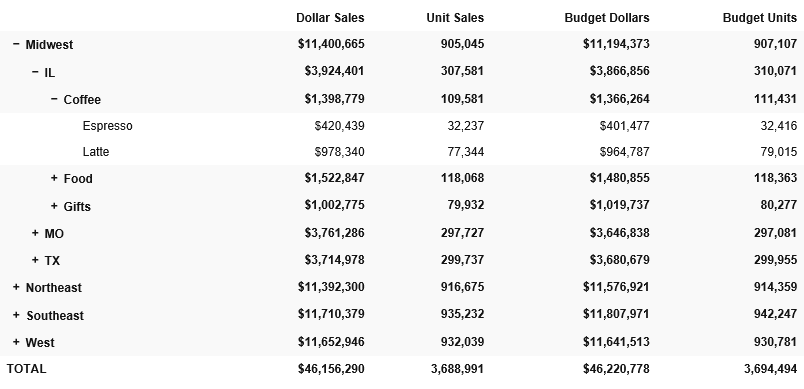
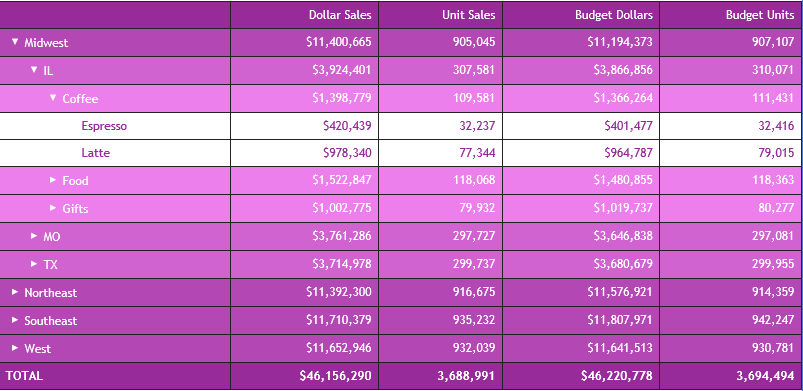
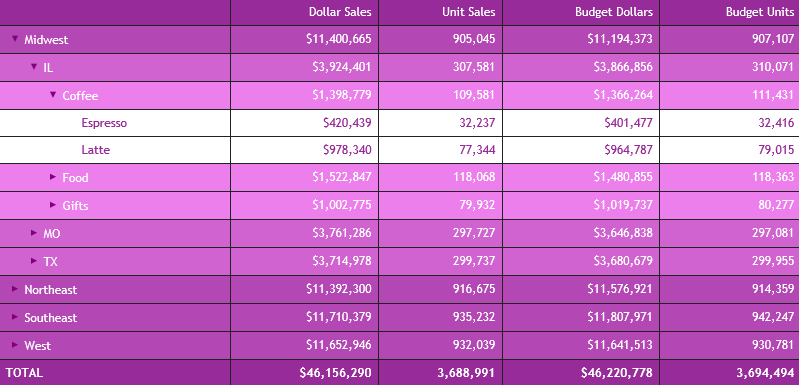
Clicking the plus sign (+) next to the Coffee category shows the products associated with that category, as shown in the following image. This is the lowest level of the Accordion By Row report.
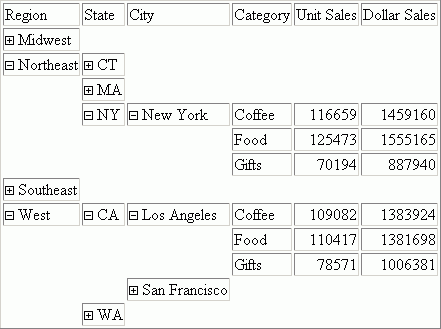
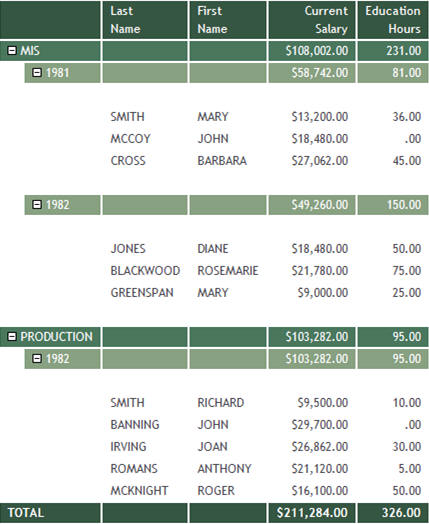
Example: Creating an Accordion By Row PRINT Report
The following request against the EMPLOYEE data source has two sort fields, DEPARTMENT and YEAR. It uses the PRINT display command.
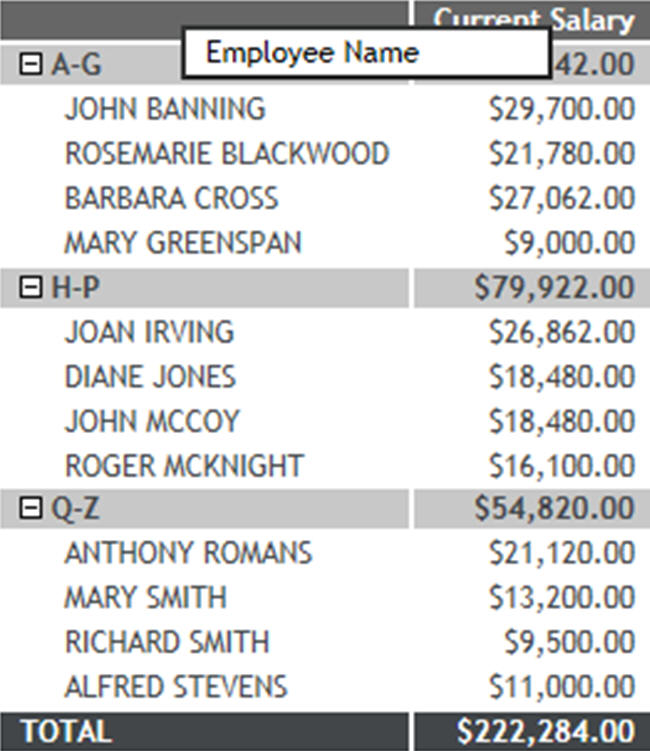
SET EXPANDBYROW = ALL
DEFINE FILE EMPLOYEE
YEAR/YY = HIRE_DATE;
YEARMO/YYM = HIRE_DATE;
END
TABLE FILE EMPLOYEE
PRINT LAST_NAME AS 'Last,Name' FIRST_NAME AS 'First,Name'
CURR_SAL AS 'Current,Salary' ED_HRS AS 'Education,Hours'
BY DEPARTMENT BY YEAR
WHERE YEAR GT 1980
ON TABLE SET HTMLCSS ON
ON TABLE SET STYLE *
TYPE=REPORT,
COLOR=RGB(66 70 73),
FONT='TREBUCHET MS',
SIZE=9,
SQUEEZE=ON,
GRID=OFF,
$TYPE=TITLE,
BACKCOLOR=RGB(102 102 102),
COLOR=RGB(255 255 255),
STYLE=-UNDERLINE+BOLD,
$
TYPE=DATA,
BACKCOLOR=RGB(255 255 255),
$
TYPE=TITLE,
    COLOR='WHITE',
    BACKCOLOR=RGB(52 85 64),
    STYLE=-UNDERLINE,
$
TYPE=HEADING,
    COLOR='WHITE',
    BACKCOLOR=RGB(52 85 64),
$
TYPE=FOOTING,
    COLOR='WHITE',
    BACKCOLOR=RGB(52 85 64),
$
TYPE=SUBTOTAL,
    BACKCOLOR=RGB(72 118 91),
$
TYPE=SUBTOTAL,
    BY=1,
    COLOR='WHITE',
$
TYPE=SUBTOTAL,
    BY=2,
    COLOR='WHITE',
    BACKCOLOR=RGB(132 159 126),
$
TYPE=SUBTOTAL,
    BY=3,
    COLOR='WHITE',
    BACKCOLOR=RGB(158 184 153),
$
TYPE=GRANDTOTAL,
    COLOR='WHITE',
    BACKCOLOR=RGB(52 85 64),
    STYLE=BOLD,
$
ENDSTYLE
END
Including the fields LAST_NAME and FIRST_NAME in the report output distinguishes each detail line. However, those fields do not apply to the summary lines, so they are blank on the summary lines.
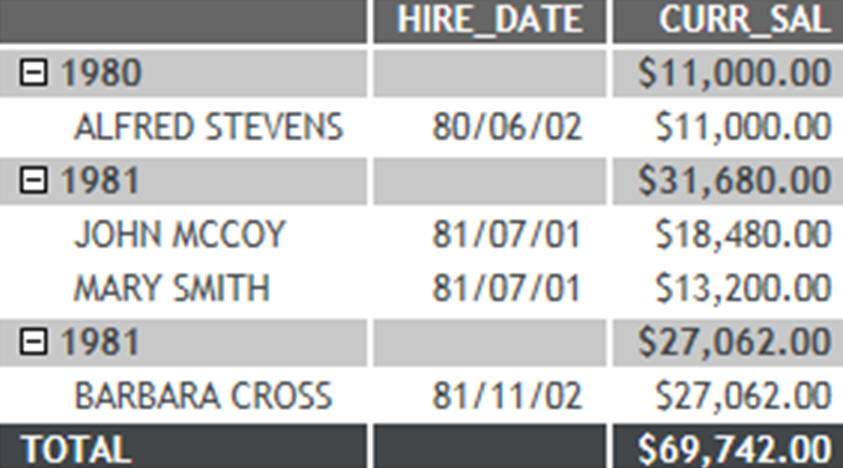
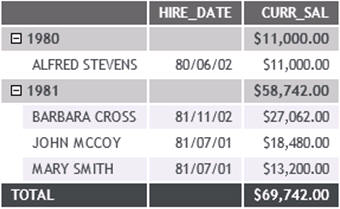
The output is:
Syntax: How to Create an Accordion Report With the Enhanced Interface
SET EXPANDBYROWTREE = {OFF|ON|ALL|n}
ON TABLE SET EXPANDBYROWTREE {OFF|ON|ALL|n}
where:
- OFF
-
Does not create an Accordion report, with the enhanced interface. OFF is the default value.
- ON
-
Creates an Accordion report, with the enhanced interface. This setting initially displays only the highest sort field level. To see rows on lower levels, click the plus sign (+) next to one of the displayed sort field values.
- ALL
-
Creates an Accordion report, with the enhanced interface. This setting displays all sort field levels initially expanded. To roll up a sort field level, click the minus sign (-) row next to one of the sort field values on that level.
- n
-
Creates an Accordion report, with the enhanced interface. This setting displays the n sort field levels initially expanded. To roll up an expanded sort field level, click the minus sign (-) next to one of the sort field values on that level.
Example: Creating an Accordion Report With the Enhanced Interface
The following request against the GGSALES data source has four sort fields, REGION, ST, CATEGORY, and PRODUCT. The request uses the default StyleSheet and the default plus sign (+) and minus sign (-) to expand or collapse a row. In order to create the Accordion report, with the enhanced interface, the SET EXPANDBYROWTREE command must be set to ON. In order to automatically resize the data to fit the size of the container, the SET AUTOFIT command must be set to ON.
TABLE FILE GGSALES
SUM DOLLARS/D8MC
UNITS/D8C
BUDDOLLARS/D8MC BUDUNITS/D8C
BY REGION
BY ST
BY CATEGORY
BY PRODUCT
ON TABLE SET EXPANDBYROWTREE ON
ON TABLE SET DROPBLNKLINE ON
ON TABLE SET AUTOFIT ON
ON TABLE PCHOLD FORMAT HTML
ON TABLE SET STYLE *
INCLUDE=IBFS:/FILE/IBI_HTML_DIR/ibi_themes/Warm.sty,$
ENDSTYLE
END
The initial output shows only the top level BY field (REGION), as shown in the following image.
Clicking the plus sign (+) next to the Midwest region opens the rows that show the states associated with that region, as shown in the following image.
Clicking the plus sign (+) next to the state IL opens the rows that show the categories associated with that state, as shown in the following image.
Clicking the plus sign (+) next to the Coffee category shows the products associated with that category, as shown in the following image. This is the lowest level of the Accordion By Row report.
You can use the EBRT_ANCHOR StyleSheet attribute to change the default plus sign (+) and minus sign (-) to an arrow. Valid settings for the EBRT_ANCHOR attribute are PLUSMINUS and ARROWS. The following request changes the default plus sign (+) and minus sign (-) to an arrow, and applies StyleSheet formatting to the request to change the color of the text to white and the background color to different shades of purple.
Note: The color of the arrows match the color of the SUBTOTAL line, in this case, white.
TABLE FILE GGSALES
SUM DOLLARS/D8MC
UNITS/D8C
BUDDOLLARS/D8MC BUDUNITS/D8C
BY REGION
BY ST
BY CATEGORY
BY PRODUCT
ON TABLE SET EXPANDBYROWTREE ON
ON TABLE SET DROPBLNKLINE ON
ON TABLE SET AUTOFIT ON
ON TABLE PCHOLD FORMAT HTML
ON TABLE SET STYLE *
TYPE=REPORT, EBRT_ANCHOR=ARROWS,
COLOR=RGB(66 70 73), FONT='TREBUCHET MS', SIZE=9, SQUEEZE=ON,$
TYPE=REPORT, FONT='TREBUCHET MS', COLOR=RGB(151 43 153),$
TYPE=TITLE, COLOR='WHITE', BACKCOLOR=RGB(151 43 153), STYLE=-UNDERLINE,$
TYPE=HEADING, COLOR='WHITE', BACKCOLOR=RGB(151 43 153),$
TYPE=FOOTING, COLOR='WHITE', BACKCOLOR=RGB(151 43 153),$
TYPE=SUBTOTAL, COLOR=WHITE, BACKCOLOR=RGB(179 72 180),$
TYPE=SUBTOTAL, BY=2, BACKCOLOR=RGB(208 99 208),$
TYPE=SUBTOTAL, BY=3, BACKCOLOR=RGB(237 127 236),$
TYPE=GRANDTOTAL, COLOR='WHITE', BACKCOLOR=RGB(151 43 153), STYLE=BOLD,$
ENDSTYLE
END
The initial output shows only the top level BY field (REGION), as shown in the following image.
Clicking the arrow next to the Midwest region opens the rows that show the states associated with that region, as shown in the following image.
Clicking the right arrow next to the state IL opens the rows that show the categories associated with that state, as shown in the following image.
Clicking the right arrow next to the Coffee category shows the products associated with that category, as shown in the following image. This is the lowest level of the Accordion By Row report.
You can use the CONTROLCOLOR StyleSheet attribute on the SUBTOTAL line to specify the color of the arrows. The following syntax shows how to change the color of the arrows to purple.
TABLE FILE GGSALES
SUM DOLLARS/D8MC
UNITS/D8C
BUDDOLLARS/D8MC BUDUNITS/D8C
BY REGION
BY ST
BY CATEGORY
BY PRODUCT
ON TABLE SET EXPANDBYROWTREE ON
ON TABLE SET DROPBLNKLINE ON
ON TABLE SET AUTOFIT ON
ON TABLE PCHOLD FORMAT HTML
ON TABLE SET STYLE *
TYPE=REPORT, EBRT_ANCHOR=ARROWS,
COLOR=RGB(66 70 73), FONT='TREBUCHET MS', SIZE=9, SQUEEZE=ON,$
TYPE=REPORT, FONT='TREBUCHET MS', COLOR=RGB(151 43 153),$
TYPE=TITLE, COLOR='WHITE', BACKCOLOR=RGB(151 43 153), STYLE=-UNDERLINE,$
TYPE=HEADING, COLOR='WHITE', BACKCOLOR=RGB(151 43 153),$
TYPE=FOOTING, COLOR='WHITE', BACKCOLOR=RGB(151 43 153),$
TYPE=SUBTOTAL, COLOR=WHITE, BACKCOLOR=RGB(179 72 180), CONTROLCOLOR=PURPLE,$
TYPE=SUBTOTAL, BY=2, BACKCOLOR=RGB(208 99 208),$
TYPE=SUBTOTAL, BY=3, BACKCOLOR=RGB(237 127 236),$
TYPE=GRANDTOTAL, COLOR='WHITE', BACKCOLOR=RGB(151 43 153), STYLE=BOLD,$
ENDSTYLE
END
The following output shows the lowest level of the Accordion By Row report, with purple arrows.
Reference: Usage Notes for EXPANDBYROW and EXPANDBYROWTREE
- As of Release 8.2 Version 04, grids are supported with EXPANDBYROWTREE.
- The maximum length of a BY field value is 245 bytes.
- EXPANDBYROWTREE is not supported with OLAP. When both OLAP and EXPANDBYROWTREE are enabled, EXPANDBYROWTREE will be ignored. As a workaround, use EXPANDBYROW.
- EXPANDBYROWTREE is not supported with the AHTML output format. When using EXPANDBYROWTREE with an active report, EXPANDBYROWTREE will be ignored.
- When running an accordion summary report against a SQL Server Analysis Services (SSAS) cube data source, the PRINT command is used internally to retrieve the data, so that the report output displayed will be that of a detailed report, instead of a summary report. This is because the SSAS cube data source contains pre-aggregated data, and therefore SUM commands are internally changed to PRINT commands.