Merging Multiple Graphs
|
How to: |
By default, when you create a graph that has multiple BY fields, or a BY and ACROSS field, multiple graphs are generated. You can merge these graphs into a single graph or into multiple merged graphs.
To do this, use the SET command GRMERGE.
Syntax: How to Merge Multiple Graphs
SET GRMERGE={ON|OFF|ADVANCED}where:
- ON
-
Turns on the merge graph option.
- OFF
-
Turns off the merge graph option. This is the default.
- ADVANCED
-
Turns on the advanced merge option. This option uses three parameters to determine how to merge the graphs:
- GRMULTIGRAPH, which specifies how many sort fields to use to create multiple graphs.
- GRLEGEND, which specifies how many sort fields to place on the graph legend.
- GRXAXIS, which specifies how many sort fields to display on the X-axis. GRXAXIS must be at least 1 in order to plot the graph. A value greater than one creates nested X-axes.
Note: The sum of the sort fields used by GRMULTIGRAPH, GRLEGEND, and GRXAXIS must equal the number of sort fields in the graph request.
The syntax for the GRMULTIGRAPH, GRLEGEND, and GRXAXIS parameters is:
- ON GRAPH SET GRMULTIGRAPH n
-
Specifies how many sort fields (0 through 2) to use to break the output into multiple graphs. The outermost sort fields are used to separate the graphs. When n is greater than zero, this is similar to GRMERGE=OFF, but allows an additional sort field.
- ON GRAPH SET GRLEGEND n
-
Specifies how many of the remaining outermost sort fields (0 through 2), after the ones used for GRMULTIGRAPH, to add to the graph legend. When n is greater than zero, this is similar to GRMERGE=ON, but allows an additional sort field.
- ON GRAPH SET GRXAXIS n
-
Specifies how many of the remaining sort fields (1 through 3) to display on the X-axis. When n is greater than 1, this creates nested X-axes.
Example: Merging Multiple Graphs With GRMERGE ON
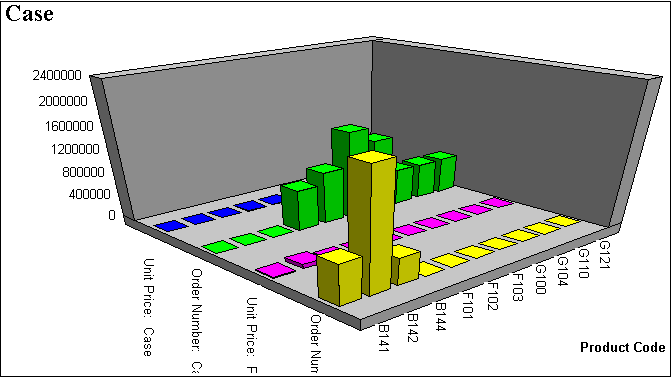
The following illustrates a graph with two horizontal, or X-axes, categories (PRODUCT_ID and PACKAGE_TYPE) that have been merged.
SET GRMERGE=ON
GRAPH FILE GGORDER
SUM UNIT_PRICE ORDER_NUMBER
ACROSS PRODUCT_ID
BY PACKAGE_TYPE
END
The output is:

Example: Merging Multiple Graphs With GRMERGE ADVANCED
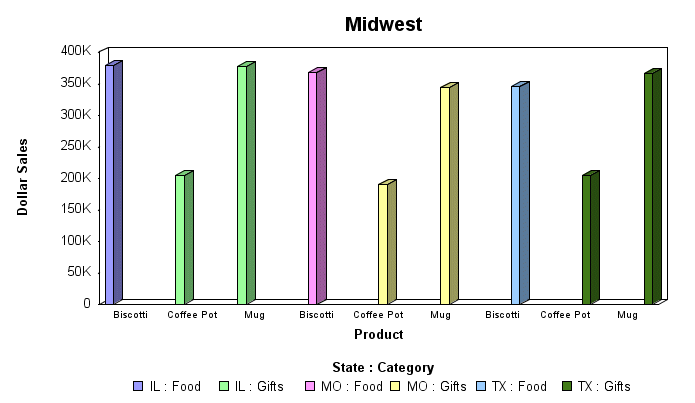
The following example generates a vertical bar graph that separates the outermost sort field (REGION) onto separate graphs, distinguishes the next two sort fields (ST and CATEGORY) by combining them on the graph legend, and places the CATEGORY sort field on the X-axis:
GRAPH FILE GGSALES
SUM DOLLARS
BY REGION BY ST BY CATEGORY BY PRODUCT
WHERE CATEGORY EQ 'Food' OR 'Gifts'
WHERE PRODUCT EQ 'Coffee Pot' OR 'Biscotti' OR 'Mug'
ON GRAPH SET GRMERGE ADVANCED
ON GRAPH SET GRMULTIGRAPH 1
ON GRAPH SET GRLEGEND 2
ON GRAPH SET GRXAXIS 1
ON GRAPH SET LOOKGRAPH VBAR
END
The first graph is for region Midwest. The legend distinguishes State-Category combinations by color, and the PRODUCT sort field is repeated on the X-axis for each State-Category combination:


