Remote Debugging
You can debug an application running on a remote AppNode through TIBCO Business Studio™ for BusinessWorks™.
Procedure
-
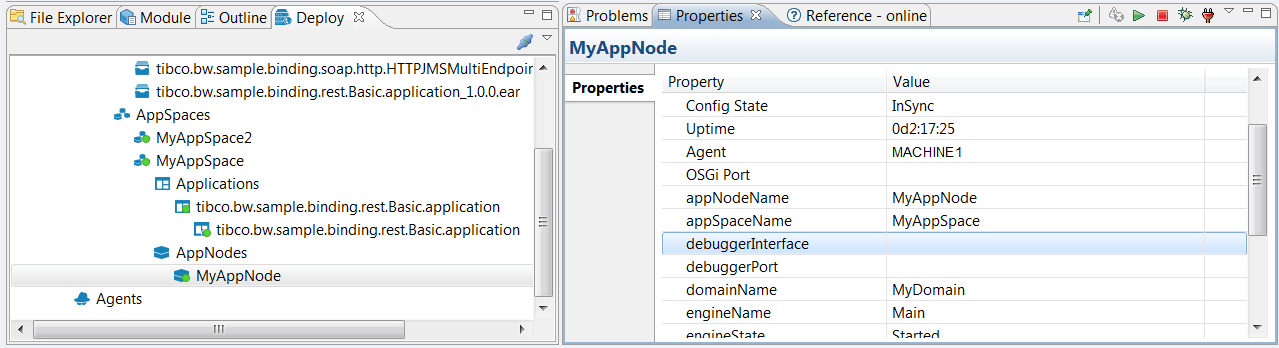
Enable the AppNode for debugging. (The AppNode must be running.)
- Open the network in the Deploy pane and choose the AppNode. The AppNode properties are displayed in the Properties pane.
-
Click the
Enable Debug
 icon in the Properties pane to enable remote debugging.
-
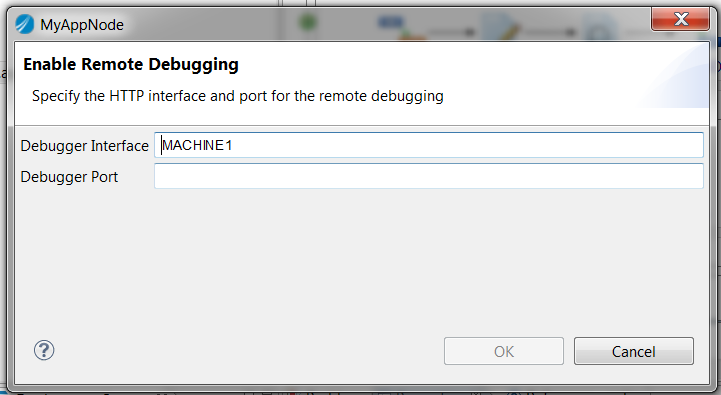
Enter the interface and port for remote debugging on the selected AppNode in the
Enable Remote Debugging dialog box.
- Debugger Interface: The interface for the debugger. This value is auto-generated.
- Debugger Port: The port to use for remote debugging. This is the same as the port number you entered for the remote debug configuration. This port cannot be in use. If the port is in use, the following message is displayed at the top of the dialog box: Internal server error
-
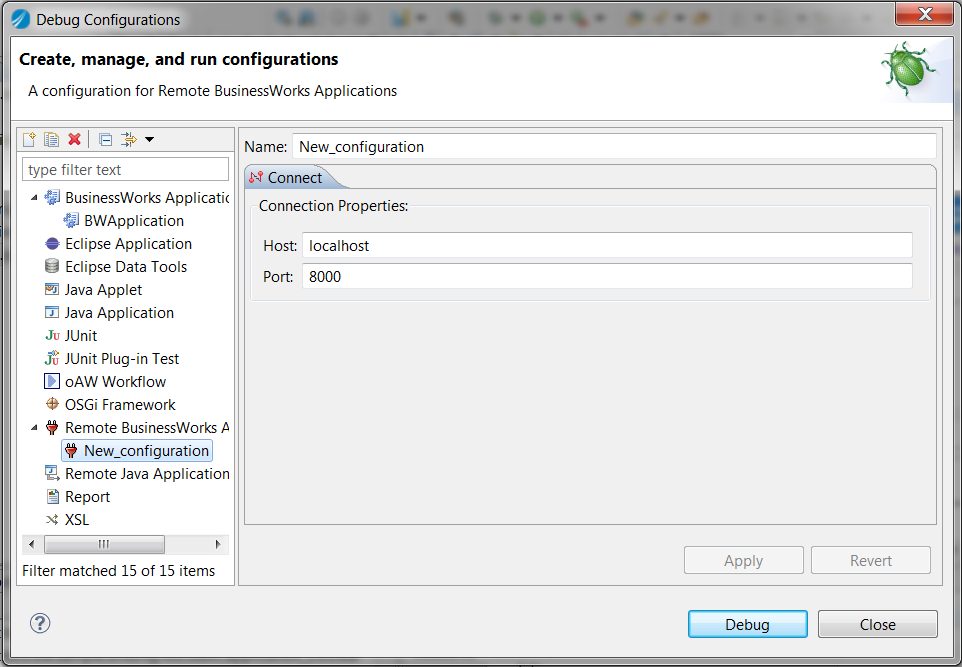
In
TIBCO Business Studio for BusinessWorks, create a Remote Debug launch configuration.
-
In the
Debug Configuration dialog box, choose
. Enter the following information:
- Name: The name of the configuration.
- Host: The name of the host. This is the agent name. To find the agent name, right-click the network name in the Deployment Servers window and choose Edit. The agent name is displayed in the Agent HTTP Interface field of the Add Network dialog box.
- Port: The remote debug port. The port cannot be in use.
-
In the
Debug Configuration dialog box, choose
. Enter the following information:
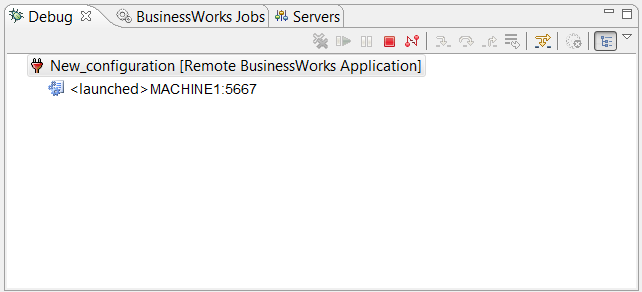
- Launch the application using the Remote Debug launch configuration.
Copyright © Cloud Software Group, Inc. All rights reserved.