Details View of the Member System Monitors
The Details View of the Member Latency shows the Member, Operations, and Distribution in a tabular format.
The top section shows the details of the number of operations performed by each member and a pie chart displaying the corresponding distribution by Members. The number of operation includes Put, Get and Take performed on all Spaces. This gives you a view of the busiest applications.
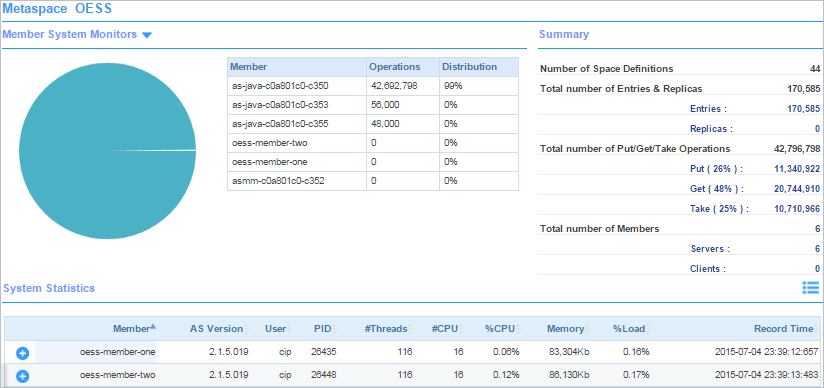
The bottom table displays the System Statistics group by member when enabled. System statistics monitor is enabled through the as-admin console.
- AS Version - software version of AS
- User - owner of the process
- PID - process identifier
- #Threads - number of threads for the process
- #CPU - number of CPU processor
- %CPU - percentage CPU utilization
- Memory - memory used
- %Load - percentage load of the system
- Record Time - recording time of this entry
Copyright © Cloud Software Group, Inc. All rights reserved.