Details View of the Member Latency
The Details View of the Member Latency shows the Member, Operations, and Distribution in a tabular format.
The top section shows the details number of operation performed by each member and a pie chart displaying the corresponding distribution by Members. The number of operation includes Put, Get and Take performed on all Spaces. This gives you a view of the busiest applications.
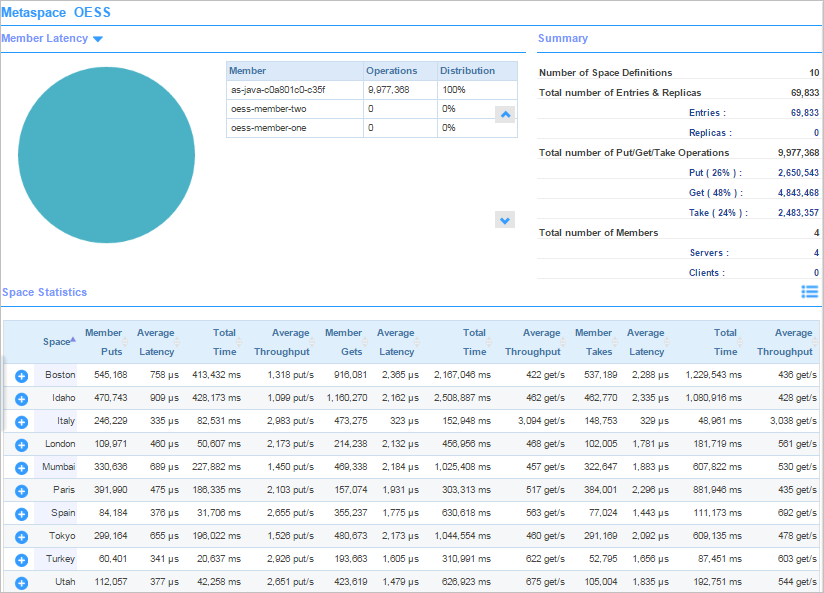
The bottom table displays the operation breakdown and the corresponding latency performed by all space member group by Space:
- Space - name of the space
- Member Puts - number of Put operation perform by all space members
- Average Latency - average time elapsed for a member to complete a Put operation in microseconds
- Total Time - total number of time spent on executing Put operations by all space members
- Average Throughput - average number of put operations per second computed based on the latency
- Member Gets - number of Get operation performed by all space members
- Average Latency - average time elapsed for a member to complete a Get operation in microseconds
- Total Time - total number of time spent on executing Get operations by all space members
- Average Throughput - average number of get operations per second computed based on the latency
- Member Takes - number of Take operation performed by all space members
- Average Latency - average time elapsed for a member to complete a Take operation in microseconds
- Total Time - total number of time spent on executing Take operations by all space members
- Average Throughput - average number of Take operations per second computed based on the latency
Copyright © Cloud Software Group, Inc. All rights reserved.