Displaying an Audit Trail

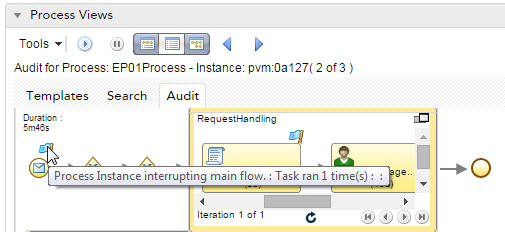
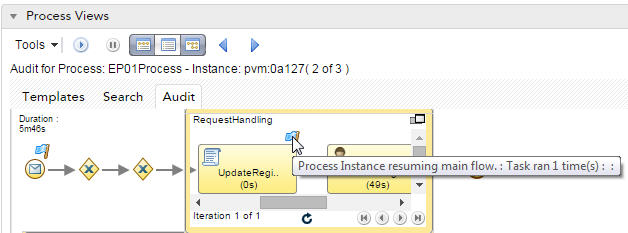
When you display the audit trail for a selected process instance, a list of events for the process instance displays. If you hover over the events, detailed information about the events displays. For example, the name, the user ID of the resource who worked on the activity and its duration.

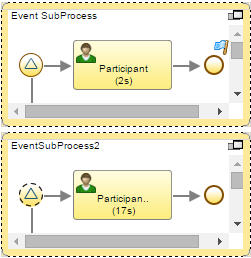
If your process template includes any sub-processes, they are displayed within the flow of the main process. However, event sub-processes are displayed below the main process, surrounded by a dotted line, as shown below. There are two types of event sub-process, interrupting and non-interrupting. If an event sub-process is non-interrupting, it's start event is surrounded by a dashed line to distinguish the event sub-process from an interrupting event sub-process. See TIBCO Business Studio Modeling Guide for more information about event sub-processes.

If your process template has been interrupted by either a manual or automatic ad-hoc activity, then blue flags in the main process highlight when the process was interrupted and when it resumed. The ad-hoc activity is displayed below the main process that it interrupted.
Note: Blue flags can also used as indicators for other activities. To identify which activity the blue flag is an indicator for, hover your cursor over the blue flag to display it's hover text.
See TIBCO Business Studio Modeling Guide for more information about ad-hoc activities.

Procedure

  1. From the Process Views gadget, select the process template whose audit trail you want to display. In the pane below, the process instances for that template are displayed.
  2. Click on the process instance whose audit trail you want to view.
  3. Double-click the process instance or click Audit.
    The Audit tab is split into three panes:
    • the top pane provides a graphical display of the audit trail, see Displaying an Audit Trail.
    • the second pane provides a chronological list of events for the process instance, see Audit Trail Columns.
    • (if you select an event in the second pane) the third pane shows the attributes applicable to the selected event, see Event Attribute Columns.
  4. From the top pane, you can:
    • (This only applies to user tasks) hover over a step in the graphical audit trail to display details about the step. Depending on the status of the step, some or all of the following information is displayed:
      Field Description
      Type The type of step, for example, user task.
      User ID The username that opened the step.
      Duration From the time the step was allocated until the time it was completed. If the step is not completed, then this is set as Pending.
      Work Time Work time measures the time when the step was opened and closed, but not completed. Work time is the sum of all the times when the step was opened and closed.
      Wait Time Wait time measures the time when the step was either allocated or closed but not completed. Wait time is the sum of all those times.
      First Offer Time The time the step was first allocated.
      First Opened Time The time the step was first opened.
      Completed Time The time the step was completed.
      Active Duration The time the step was first allocated until the time the step was completed.
      Action Duration The time the step was first opened until the time the step was completed.
    • click on a step in the graphical audit trail; the corresponding event is highlighted in the second pane.
    • double-click on a step; all the events from all the components that have affected that step are displayed in the second pane.
  5. You can toggle between the panes in the Audit tab, using the toggle buttons described below:
    Button Description
    The icon is a dialog containing an example of a process flow. Opens or closes the graphical audit trail depending on the context you are in.
    The dialog is an example of an event attribute list Opens or closes event list, depending on the context you are in.
    The icon is an example of the audit trail for a process Opens or closes the event attribute list, depending on the context you are in.

    You can view the next or previous process instance in the list by using The icon is an arrow pointing to the right or The icon is an arrow pointing to the left.