Launching the Tester
The tester allows you to connect to the remote engine and debug the existing processes running on that engine. Once the tester is launched, you are placed into the Debug view.
Procedure
-
Notice that in the Debug perspective, various panels display different aspects of the process being debugged.
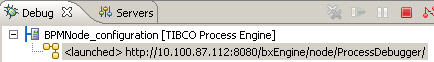
- BPMNode_configuration—Specifies name of the configuration to connect to TIBCO Process Engine.
- host name8080/bxEngine/node/ProcessDebugger—Specifies the name of the debug target and the TIBCO Process Engine that the BPMN tester connects to. Its label format is:
<state>TIBCO Process Engine at <host>:<port number>
where <state> is either <launched> or <terminated>.
After you select a process, the details of the testpoints and breakpoints used in the process are displayed in the top right area in the Testpoints and Breakpoints views. Variables can be seen in the Variables view only when a process instance starts and hits a breakpoint.

Copyright © Cloud Software Group, Inc. All rights reserved.