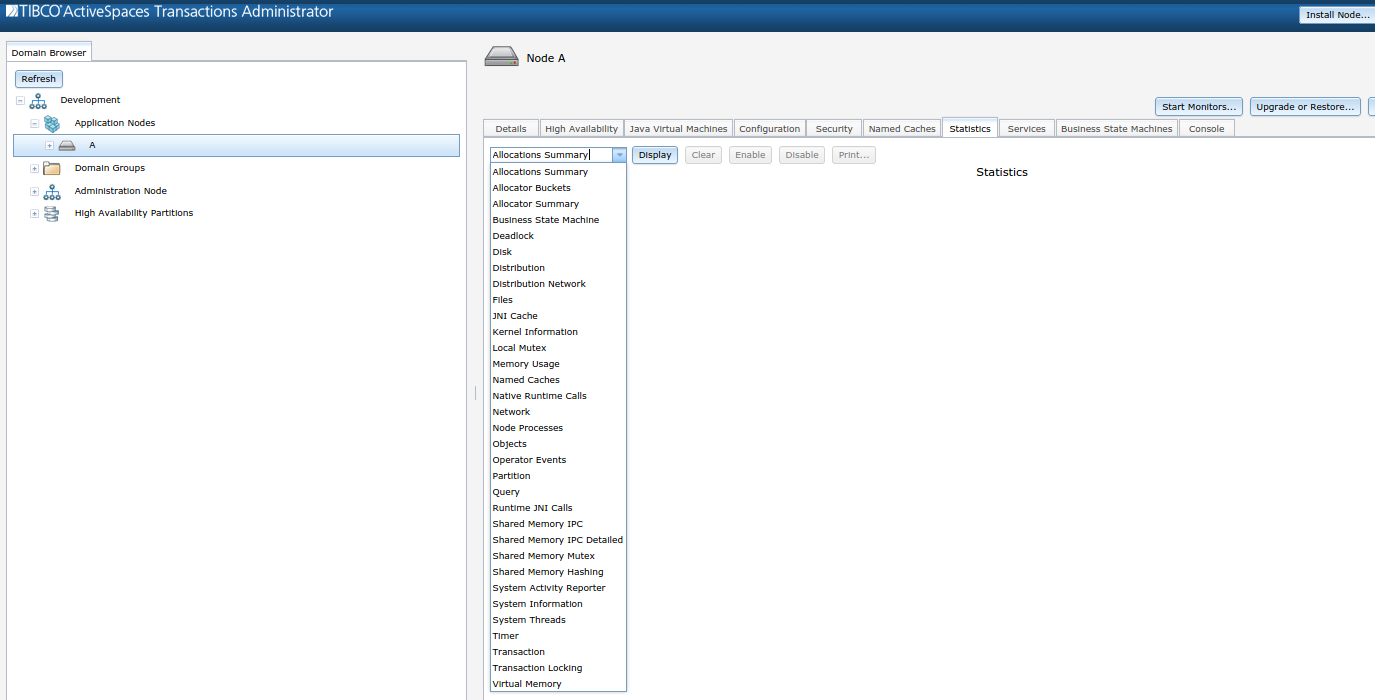
The ActiveSpaces® Transactions
Administrator offers
access a variety of statistics via the statistics
tab of the Node panel.
Application, node, and system level reports are available and
are selected via the pull down menu:
Some of these statistics are collected automatically
by the runtime. For these, the Enable
and Disable buttons will not be greyed out
and not clickable.
Clicking the Display button will show the
current values.
Other statistics need to be enabled in order to
activate data collection. Generally this is because the
collection of these statistics imposes some performance,
memory usage, or disk usage penalty upon the system.
For these, the Enable
button must be clicked, and the desired amount of time should
be waited before clicking the Display button
to show the collected statistics.
It is also good practice to disable the statistic collection,
by pressing the Disable button, before
displaying the report.
This restores the system to its previous performance level,
and also keeps the reporting itself from showing up in
the measurement.
Some statistics support clearing. Those statistics
may be cleared at any time by pressing the Clear
button.
For statistics that do not support clearing the Clear
button will be greyed out and not clickable.
After a report is displayed, it may be printed by clicking
the Print button.
