Finer grained transaction statistics, tied to each class which implements com.kabira.platform.Transaction are also available. The collection of these statistics imposes a slight performance penalty and is not enabled by default.
These statistics are available while the node is running.
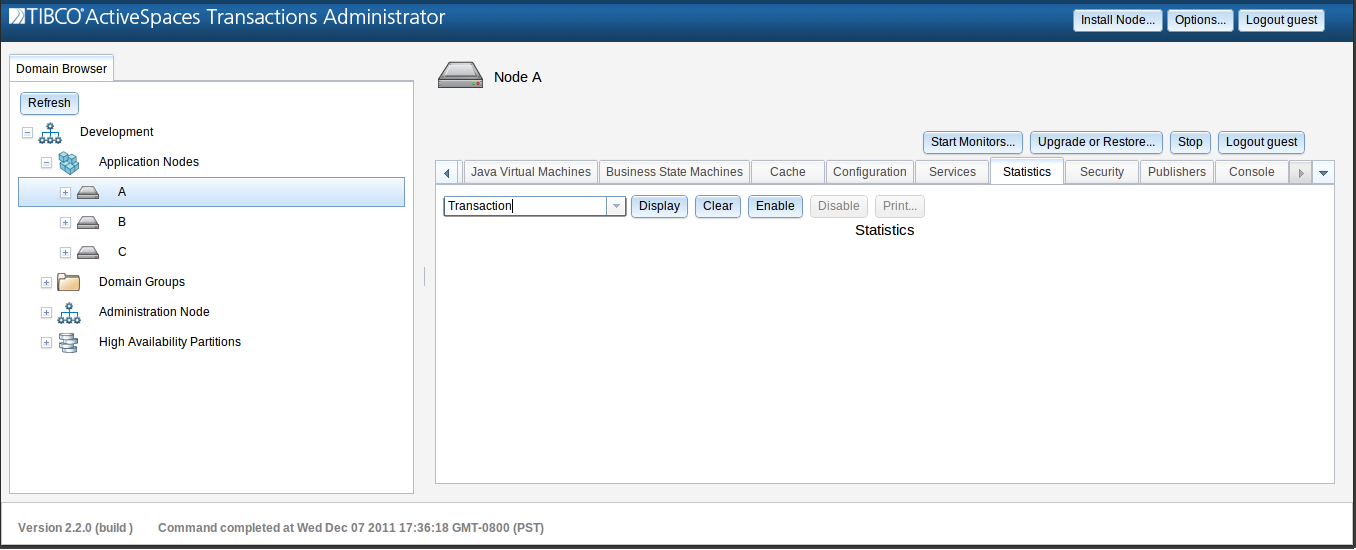
To collect these statistics, select Transaction in the pull down menu in the statistics panel:
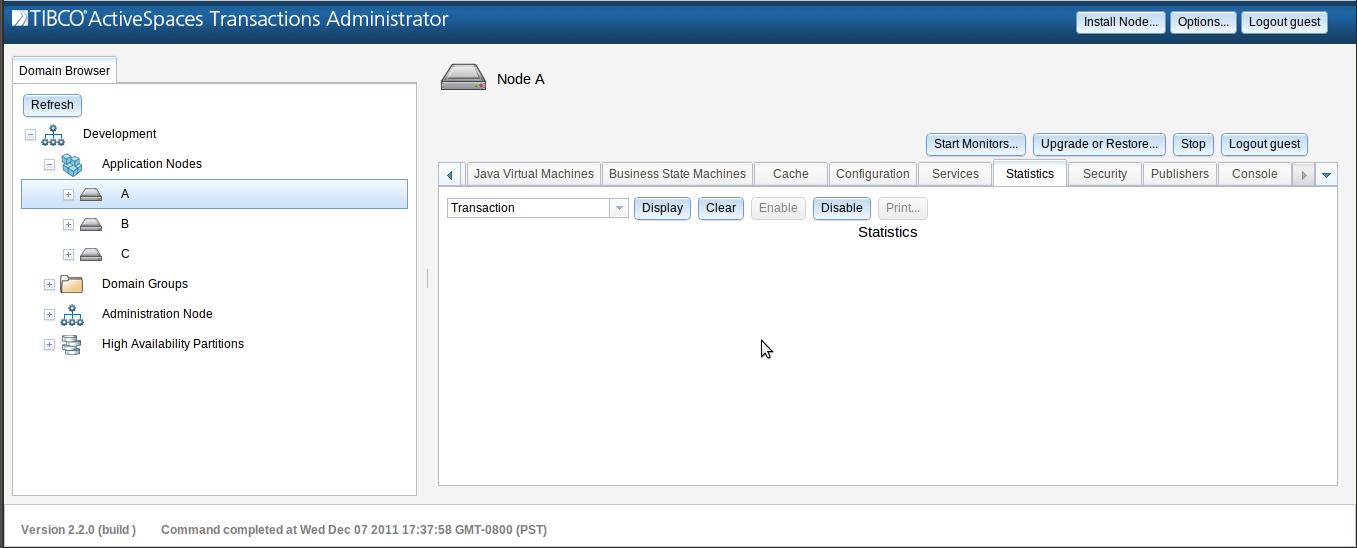
Next enable the collection of these statistics by clicking
the Enable button:
Allow the data to collect for several seconds or more,
and then disable statistics collection by clicking the
Disable button.
Disabling the statistics collection removes the slight performance
penalty and allows the system to run at full speed.
Disabling the statistics collection does not remove the collected statistics.
Display the collected statistics by clicking the
Display button:
Number of Transactions - The number of times this transaction executed and committed while the statistic was enabled (exceptions and rollbacks are not counted).
Average Latency - the average execution time for this transaction. This number includes the prepare and commit times.
Minimum Latency - the minimum execution time for this transaction. This number includes the prepare and commit times.
Maximum Latency - the maximum execution time for this transaction. This number includes the prepare and commit times.
Average Prepare - the average execution time for the prepare phase of this transaction.
Minimum Prepare - the minimum execution time for the prepare phase of this transaction.
Maximum Prepare - the maximum execution time for the prepare phase of this transaction.
Average Commit - the average execution time for the commit phase of this transaction.
Minimum Commit - the minimum execution time for the commit phase of this transaction.
Maximum Commit - the maximum execution time for the commit phase of this transaction.
Deadlocks - the number of times this tranasaction deadlocked. Times for deadlocked transactions are not included in the latency, commit and prepare times.
Rollback - the number of times this tranasaction rolled back. Times for rolled back transactions are not included in the latency, commit and prepare times.
Exceptions - the number of times this tranasaction failed due to an unhandled exception. Times for transactions ended by exception are not included in the latency, commit and prepare times.
Name - Either the name of the transaction, if provided to the Transaction constructor, or the name of the class, if the empty constructor was used.
The following snippet, which demonstrates both a named, and an unnamed transaction, was used to generate the system load:
// $Revision: 1.1.2.1 $
package com.kabira.snippets.tuning;

import com.kabira.platform.Transaction;

/**
 * SimpleTransactions example from the ActiveSpaces Transactions Tuning Guide
 * for generating transaction statistics.
 *
 * <p>
 * <h2> Target Nodes</h2>
 * <ul>
 * <li> <b>domainnode</b> = A
 * </ul>
 */

public class SimpleTransactions
{
    public static void main(String[] args)
    {
        while (true)
        {
            // This is a named transaction
            new Transaction("Example Transaction")
            {
                @Override
                public void run()
                {
                    try
                    {
                        Thread.sleep(500);
                    }
                    catch (InterruptedException ex) { }
                }
            }.execute();

            // This is an unnamed transaction
            new Transaction()
            {
                @Override
                public void run()
                {
                    try
                    {
                        Thread.sleep(500);
                    }
                    catch (InterruptedException ex) { }
                }
            }.execute();
        }
    }
}
The currently collected statistics may be cleared (reset) at any
time by clicking the Clear button.
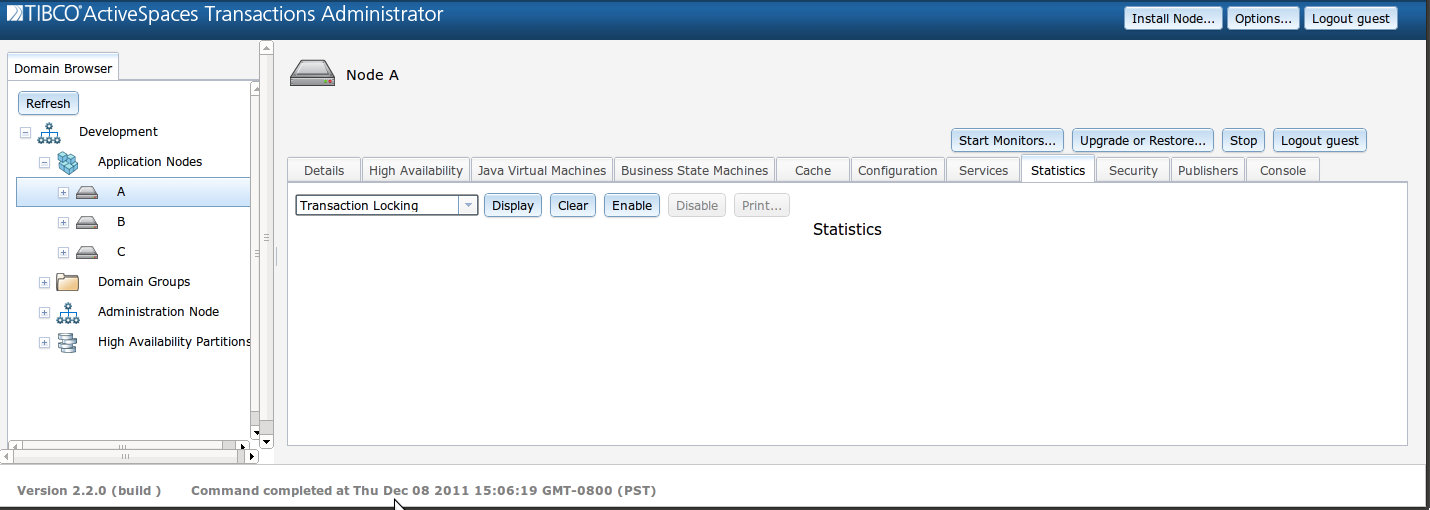
A report showing transaction locking is available by selecting Transaction Locking in the pull down menu in the statistics panel:
The collection of transaction locking statistics imposes
a slight performance penalty and is not enabled by default.
After having selected the Transaction Locking,
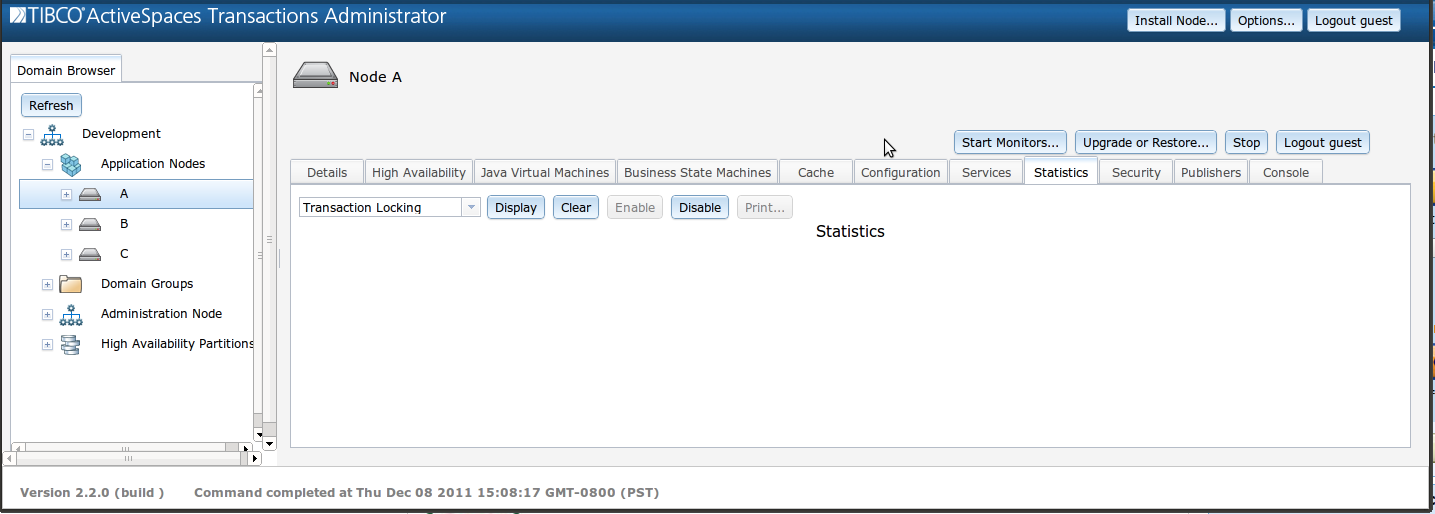
enable the collection of these statistics by clicking
the Enable button:
Allow the data to collect for several seconds or more,
and then disable statistics collection by clicking the
Disable button.
Disabling the statistics collection removes the slight performance
penalty and allows the system to run at full speed.
Disabling the statistics collection does not remove the collected statistics.
Display the collected statistics by clicking the
Display button:
The columns of each row are:
Type Name - the class for the Managed object.
Read Locks - the number of transaction read locks that were taken on instances of this class during the period of statistics collection.
Write Locks - the number of transaction write locks that were taken on instances of this class during the period of statistics collection.
Promotions - the number of read locks that were promoted to write locks on instances of this class during the period of statistics collection. This is a subset of the number of write locks.
Contentions - the number of transaction locks on this object that encountered transaction lock contention during the period of statistics collection.
Deadlocks - the number of deadlocks other than promotion deadlocks that occurred attempting to transaction lock this object during the period of statistics collection.
Promotion Deadlocks - the number of deadlocks that occurred attempting transaction lock promotion (from read to write) on this object during the period of statistics collection.
Average Microseconds - the average time in microseconds that it took to acquire a transaction lock on this object during the period of statistics collection.
Minimum Microseconds - the minimum time in microseconds that it took to acquire a transaction lock on this object during the period of statistics collection.
Maximum Microseconds - the maximum time in microseconds that it took to acquire a transaction lock on this object during the period of statistics collection.
![[Note]](images/note.png) | |
Transaction locking statistics should only be collected by one user at a time. Multiple concurrent collection will cause invalid data to be reported. |
Documentation for the Business State Machine report can be found in the administration section of the site documentation for the Business State Machine component:
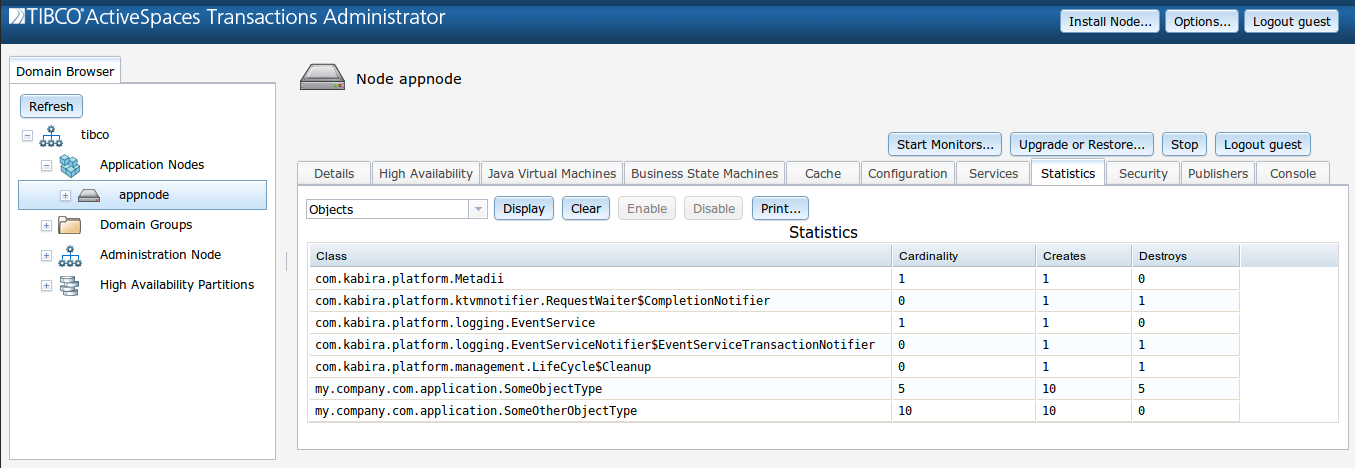
A report showing Managed objects statistics.
These statistics are available while the node is running.
There is a row in the report for each Managed object type that has any non-0 data during since the data was last cleared. The columns in the report are:
Class - the class name.
Cardinality - the number of instances currently in shared memory.
Creates - the number of instances created since the data was last cleared.
Destroys - the number of instances destroyed since the data was last cleared.
The Creates and Destroys counts are non-transactional. They represent the number of times that these operations occurred without respect to the outcome of their containing transactions. For example, if one create was done, but a deadlock occurred, and the transaction rolled back, and then replayed successfully, the Creates count would be 2.
A report showing query counts for Managed objects.
These statistics are available while the node is running.
There is a row in the report for each Managed object type that has
been accessed via ManagedObject.extent() or
ManagedObject.cardinality(), and for each key type
that has been accessed since the data was last cleared.
The columns in the report are:
Select - the number of times the Key was accessed during the period measured.
Cluster Scope - the number of distributed queries during the period measured.
Iteration - the number of times
ManagedObject.extent()was called for the type during the period measured.Objects Iterated - the total number of objects iterated on results from
ManagedObject.extent()orKeyQuery.getResults()during the period measured.Cardinality - the number of times
ManagedObject.cardinality()was call for the type during the period measured.Class/Key Name - the type name (Extent) or the Key name.
When ActiveSpaces® Transactions detects a deadlock, detailed information is sent to the log files. See the Analyzing Deadlocks section of the Chapter 4, Tuning for more information on interpreting this log data.
In addition to descriptive logging of each deadlock encountered,
there are several statistics maintained that can been seen from
selecting the Deadlock statistic in the statistics pull down menu, and
clicking the Display button:

Number of Deadlocks - the number deadlocks seen since the last time the statistics were cleared.
Number of Deadlock Backoffs - the number of times an extra wait was inserted before a deadlock retry. For a given execution of a transaction, the first deadlock will be immediately aborted and retried. The next deadlock will incur a 100 millisecond wait time before it is retried. For each subsequent deadlock (in the same execution of a single transaction) the wait time will be doubled.
Minimum Backoff Time (milliseconds) - the minimum amount of time, in milliseconds, a transaction spent waiting before retrying.
Maximum Backoff Time (milliseconds) - the maximum amount of time, in milliseconds, a transaction spent waiting before retrying.
Average Backoff Time (milliseconds) - the average amount of time, in milliseconds, a single transaction spent waiting before retrying.
These statistics are always collected, and may be
cleared at any time by clicking the Clear
button.
These statistics are available while the node is running.
![[Note]](images/note.png) | |
All deadlocks are inherently performance hostile and should be avoided by modifying the application to avoid the deadlock condition. |
A report showing the timers currently queued in the node.
These statistics are available while the node is running.

There is a row in the report for each
com.kabira.platform.swtimer.TimerNotifier
class that has any timers currently started.
The columns in the report are:
OneShots - the number of one shot timers that are currently started with this notifier class.
Recurring - the number of recurring timers that are currently started with this notifier class.
Highly Available - whether or not the timer notifier class is highly available.
Notifier Class - the class extending
com.kabira.platform.swtimer.TimerNotifierused for the one shot and recurring timers.Process - the process (typically a JVM) where the timers were started.
