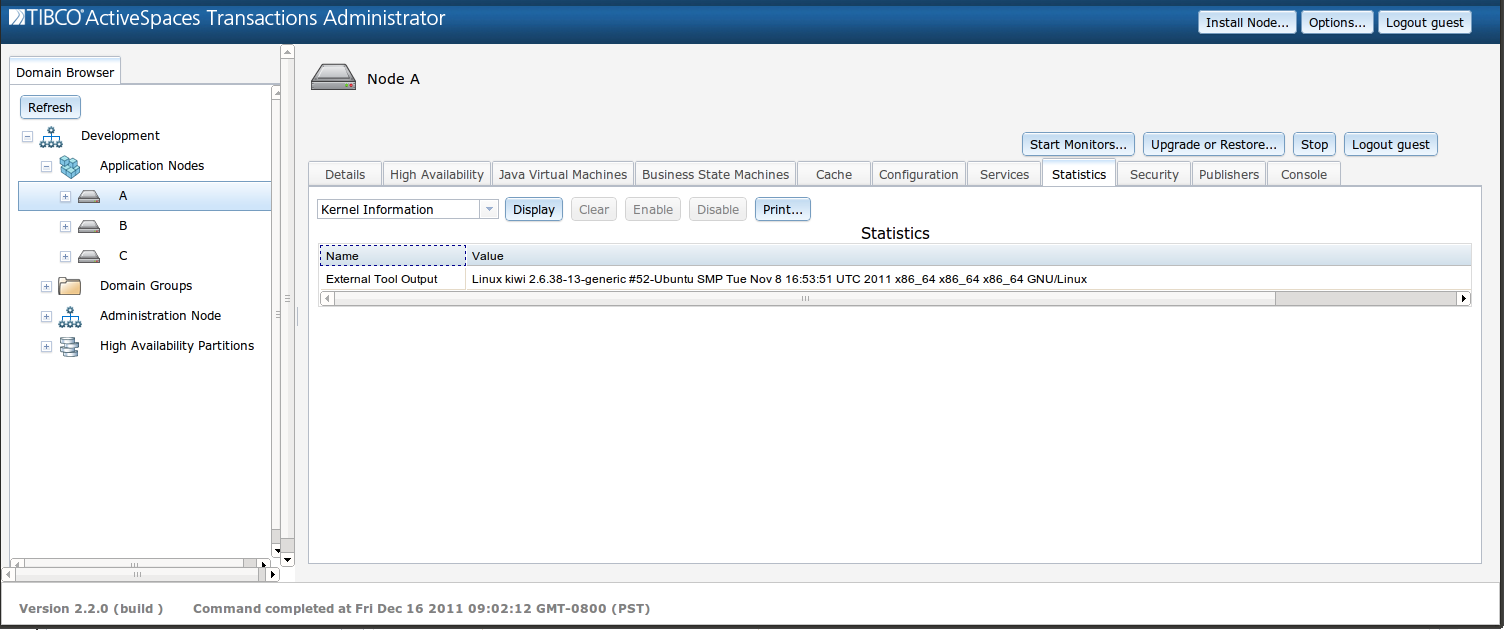
Show information about the version of the operating system.
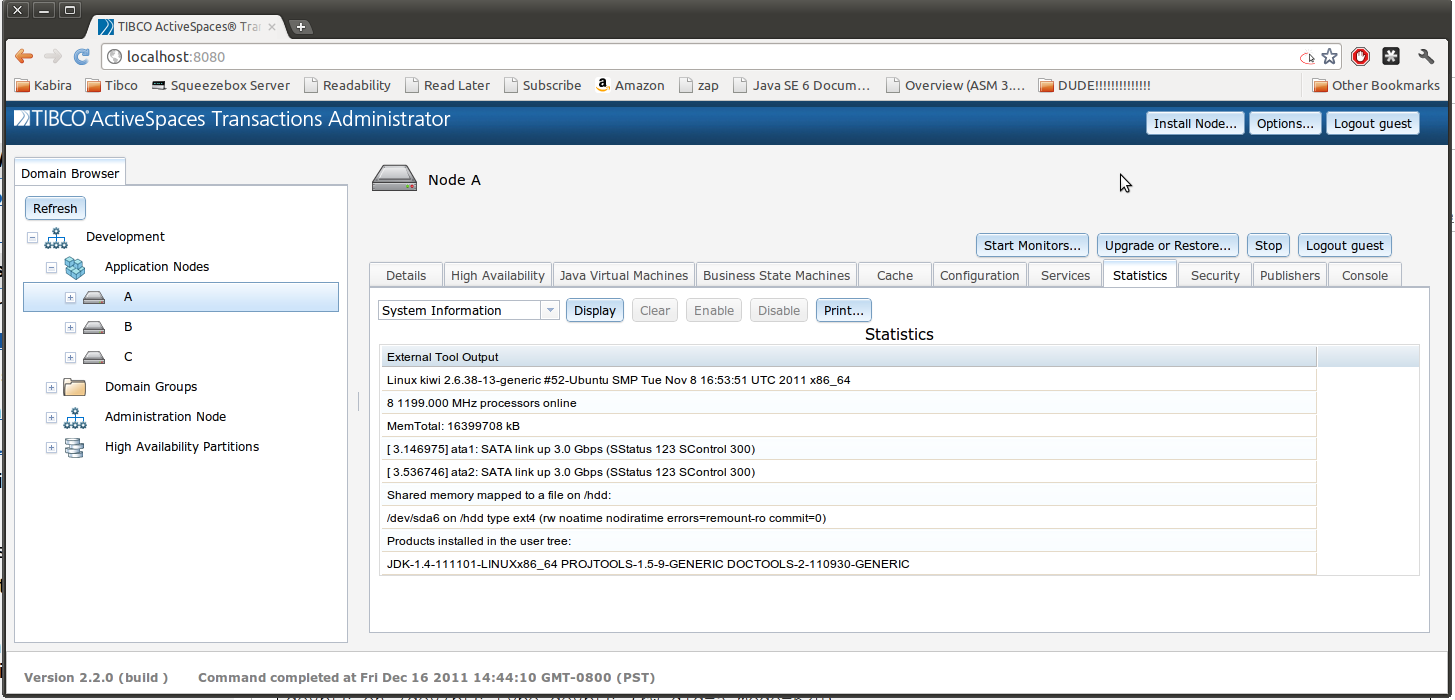
Show information about the system, including the number of CPUs and their speed, the amount of physical memory, and shared memory mapping.
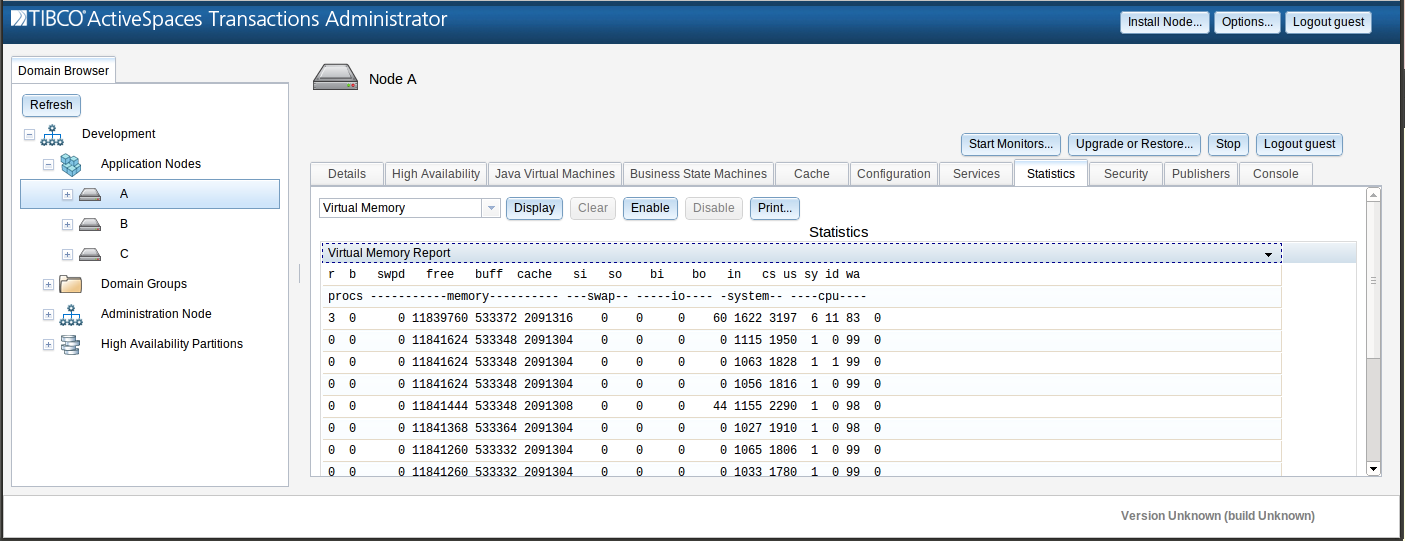
The Virtual Memory Report directly captures the output of a
platform specific tool.
On Unix systems this is vmstat run with a 1
second sampling interval.
Because running this tool consumes a small amount of CPU
and an amount of disk space that is proportional to how long the
tool is run, it is not enabled by default.
To enable, select Virtual Memory in the pull down menu
in the statistics panel and click the Enable
button:
Allow the data to collect for the desired amount of time
and then disable the collection by clicking the
Disable button.
Display the collected statistics by clicking the
Display button.
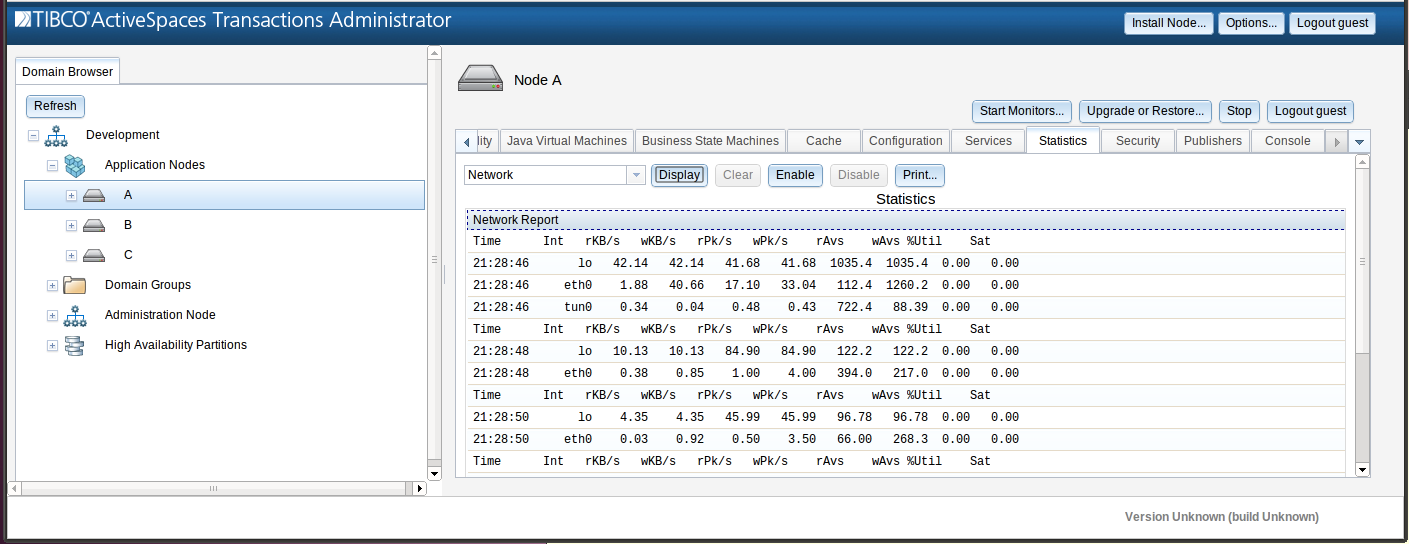
The Network Utilization Report directly captures the
output of a platform specific tool.
On Unix systems this is nicstat.
run with a 2 second sampling interval.
Because running this tool consumes a small amount of CPU and an
amount of disk space that is proportional to how long the tool is run,
it is not enabled by default.
To enable, select Network in the pull down menu
in the statistics panel and click the Enable
button:
Allow the data to collect for the desired amount of time and
then disable the collection by clicking the
Disable button.
Display the collected statistics by clicking the
Display button:
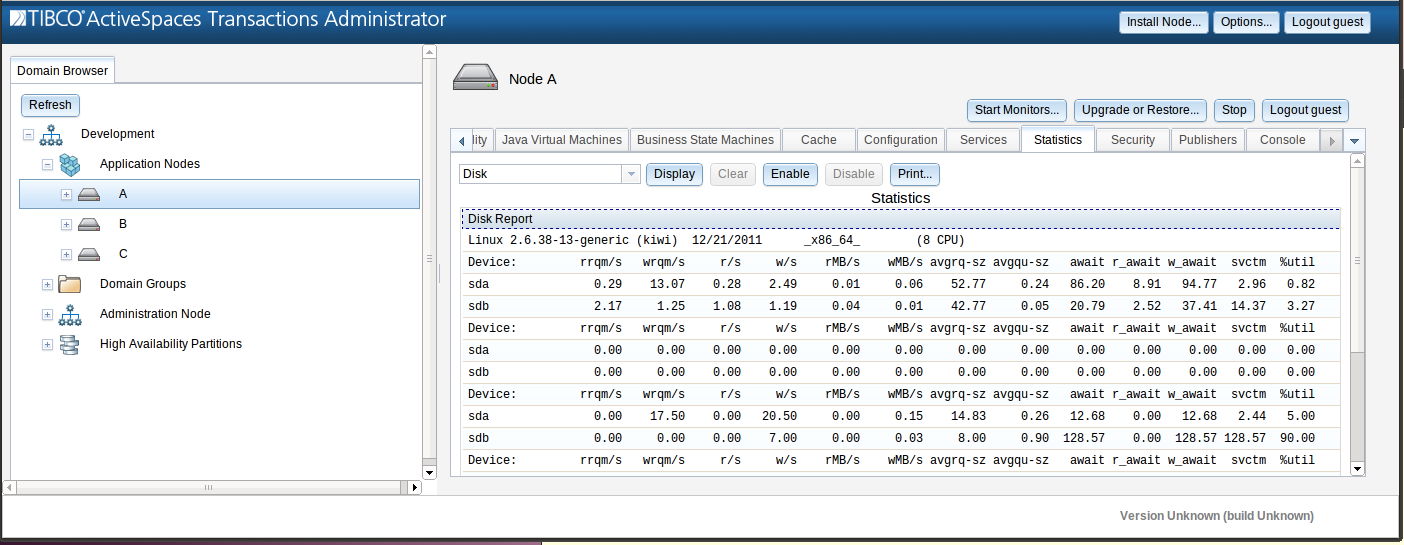
The disk utilization report directly captures the output
of a platform specific tool.
On Unix systems this is iostat
run with a 2 second sampling interval.
Because running this tool consumes a small amount of CPU
and an amount of disk space that is proportional to how long the
tool is run, it is not enabled by default.
To enable, select Disk in the pull down menu
in the statistics panel and click the
Enable button:
Allow the data to collect for the desired amount of time and
then disable the collection by clicking the
Disable button.
Display the collected statistics by clicking the
Display button:
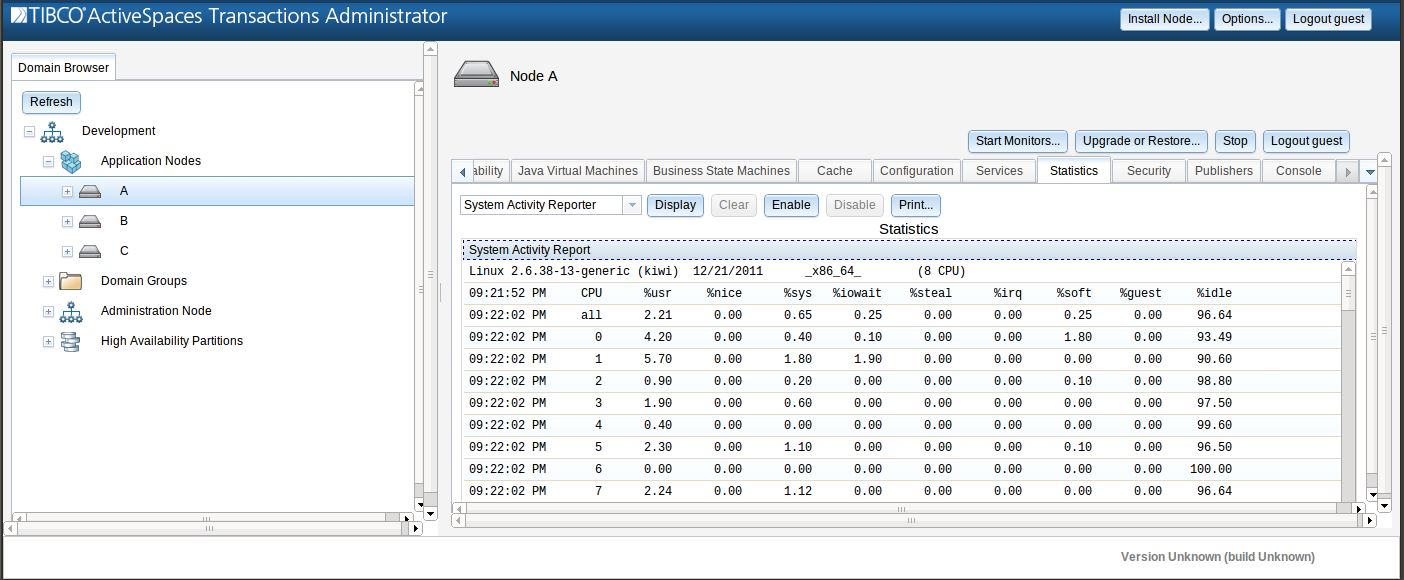
The System Activity Report directly captures the output of a platform specific tool.
On Unix systems this is sar.
Because running this tool consumes a small amount of CPU and an
amount of disk space that is proportional to how long the tool is run,
it is not enabled by default.
To enable, select System Activity Reporter in
the pull down menu in the statistics panel and click the
Enable button:
Allow the data to collect for the desired amount of time
and then disable the collection by clicking the
Disable button.
Display the collected statistics by clicking the
Display button:
