A variety of reports are available within the statistics panel which apply to an entire node.
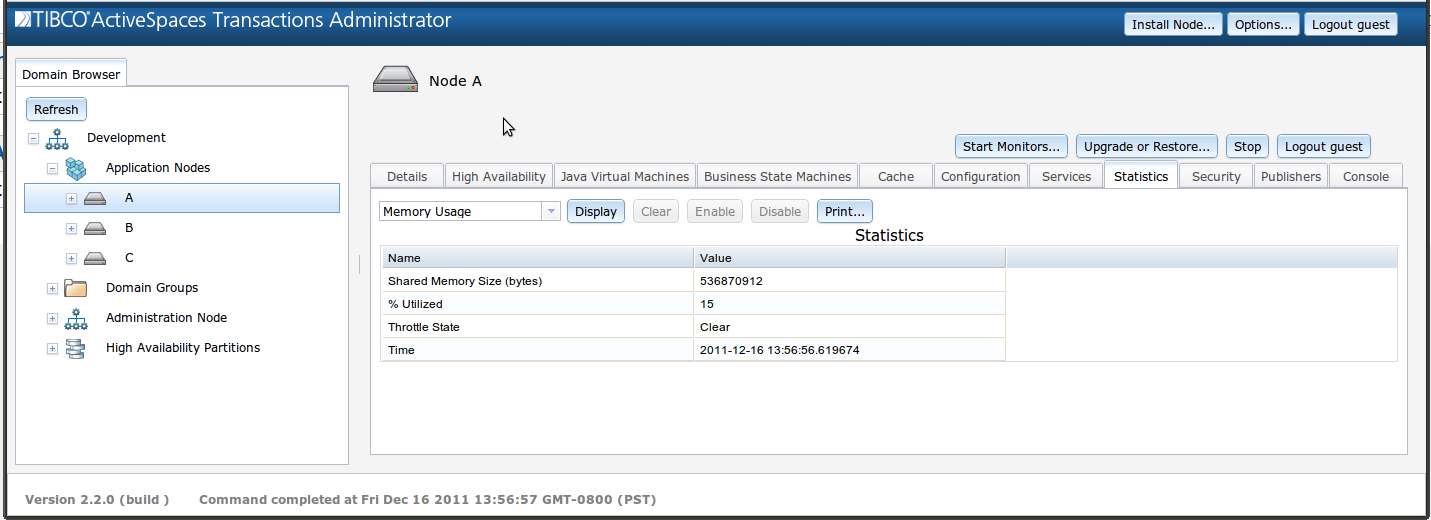
Show the current shared memory utilization within the node.
These statistics are available while the node is running.
Shared Memory Size - The total size of the shared memory, in bytes.
% Utilized - Current percentage of shared memory that is in use.
Throttle State - Historical list, in reverse order of memory throttling state changes. See
com.kabira.platform.swbuiltin.EngineServices.throttle()for details about memory throttling.Time - The time of the memory throttling state change, or of the last check of the memory throttling state.
Show statistics for currently defined named caches within the node.
These statistics are available while the node is running.
Name - The name of the cache.
Size - The configured size of the cache in bytes.
Object Count - The number of objects currently in the cache.
Object Flushes - The number of objects that have been flushed since the last time the named cache statistics were cleared.
Throttle Flushes - The number of objects that were flushed due to memory throttling since the last time the named cache statistics were cleared.
Flush Idle Count- The number of times the flusher thread has run and found nothing to flush since the last time the named cache statistics were cleared.
Not Fully Flushed Count - The number of times the flusher thread has run and not been able to bring the cache back to under the configured size since the last time the named cache statistics were cleared.
Flush Vetoes - The number of object flushes that were vetoed by a FlushNotifier since the last time the named cache statistics were cleared.
Exceptions - The number of exceptions that have occurred in FlushNotifiers since the last time the named cache statistics were cleared.
Memory Utilization - What percentage of the entire shared memory is being used by the cache.
Cache Utilization - What percentage of the configured cache size is currently being used.
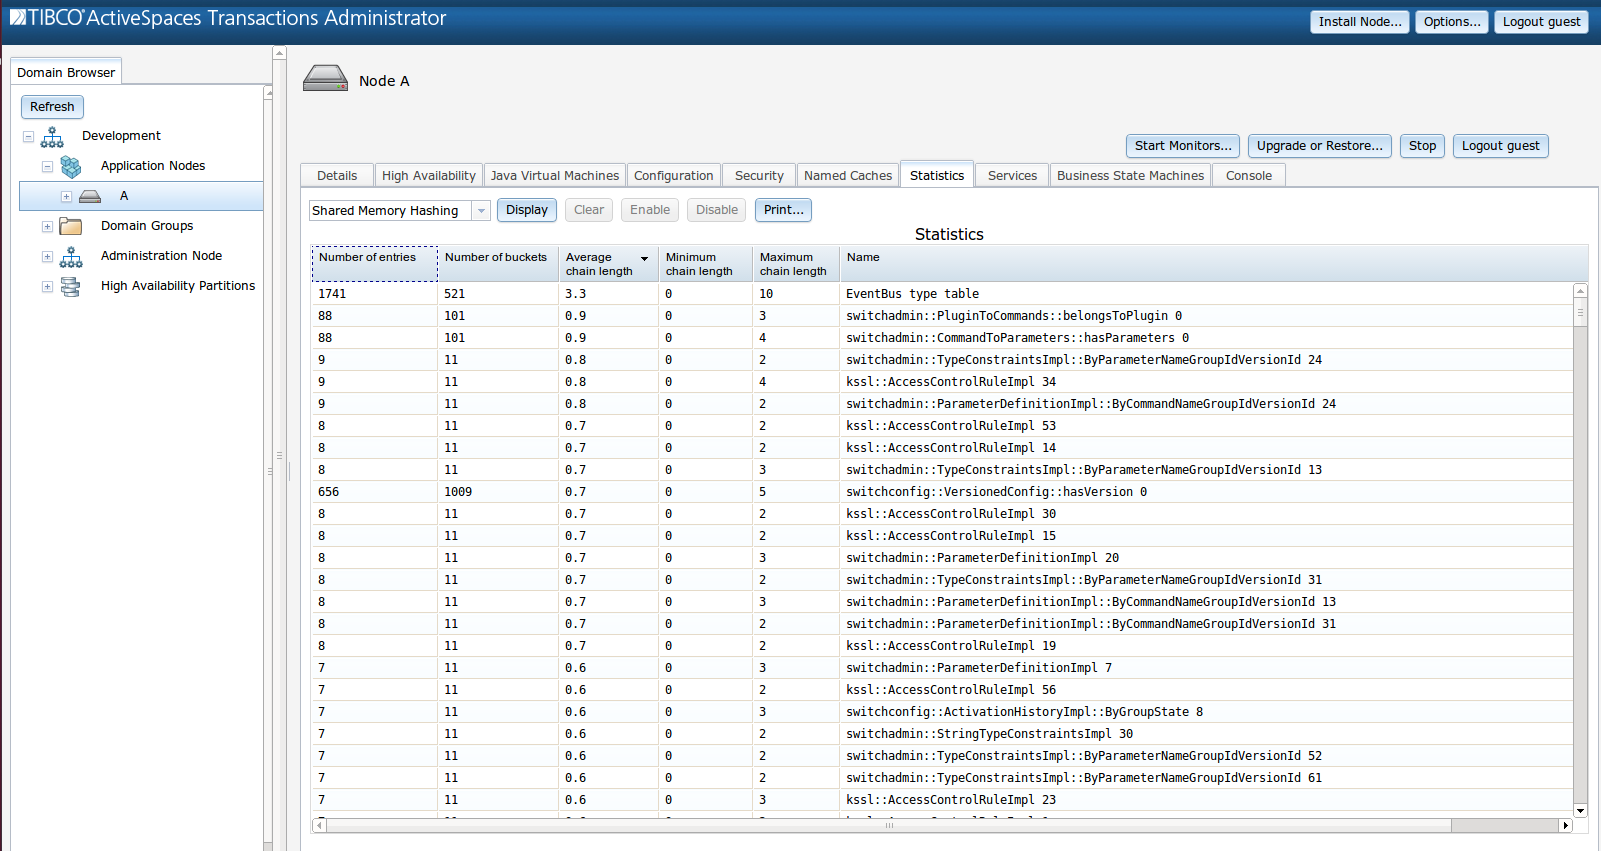
Show current characteristics of system shared memory data structure hashes.
These statistics are available while the node is running.
Number of entries - The total number of items in the hash.
Number of buckets - The number of hash buckets for the hash.
Average chain length - The average length of the lists chained from each hash bucket.
Minimum chain length - The minimum length for a list chained from any of the hash buckets.
Maximum chain length - The minimum length for a list chained from any of the hash buckets.
Name - The name of the system data structure.
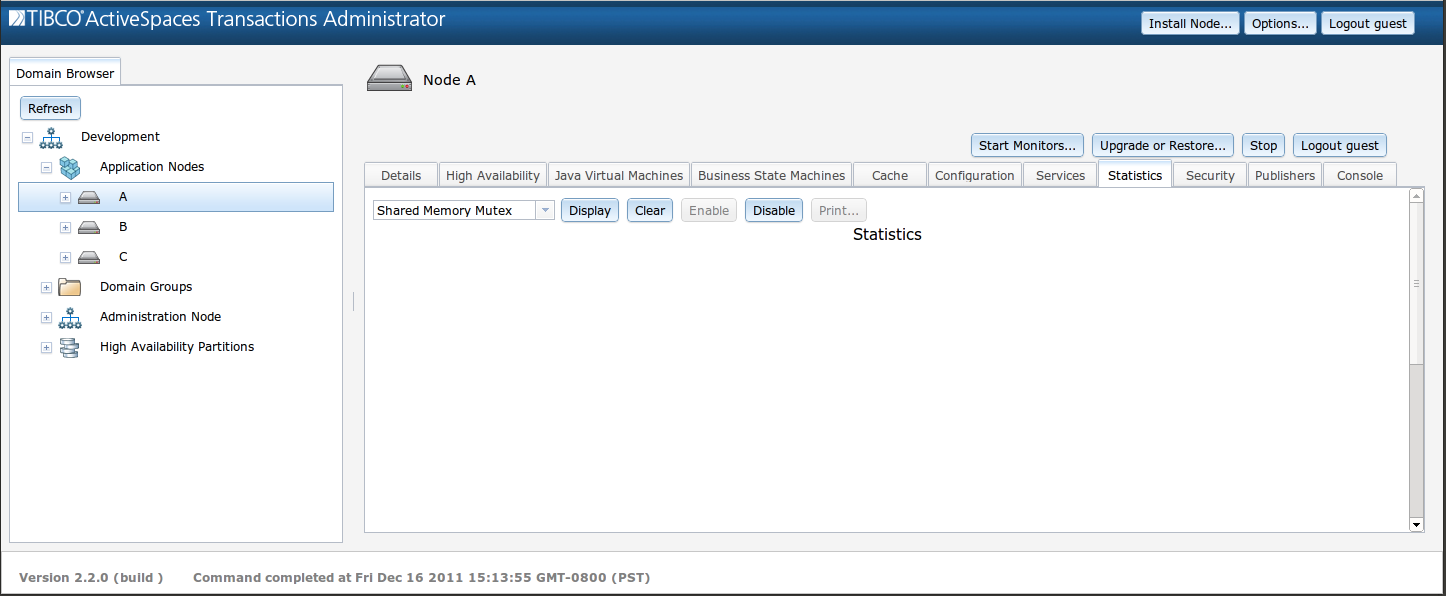
A report showing shared memory system mutex locking is available
by selecting Shared Memory Mutex in the pull down menu in the statistics
panel, and enabling collection by clicking the Enable
button.
The collection of mutex locking statistics imposes a slight
performance penalty and is not enabled by default.
These statistics are available while the node is running.
Note that mutex statistics report on low level runtime synchronization primitives that are not directly exposed to or manipulated by application code.
Allow the data to collect for several seconds or more, and then
disable statistics collection by clicking the
Disable button.
Disabling the statistics collection removes the slight performance
penalty and allows the system to run at full speed.
Disabling the statistics collection does not remove the collected statistics.
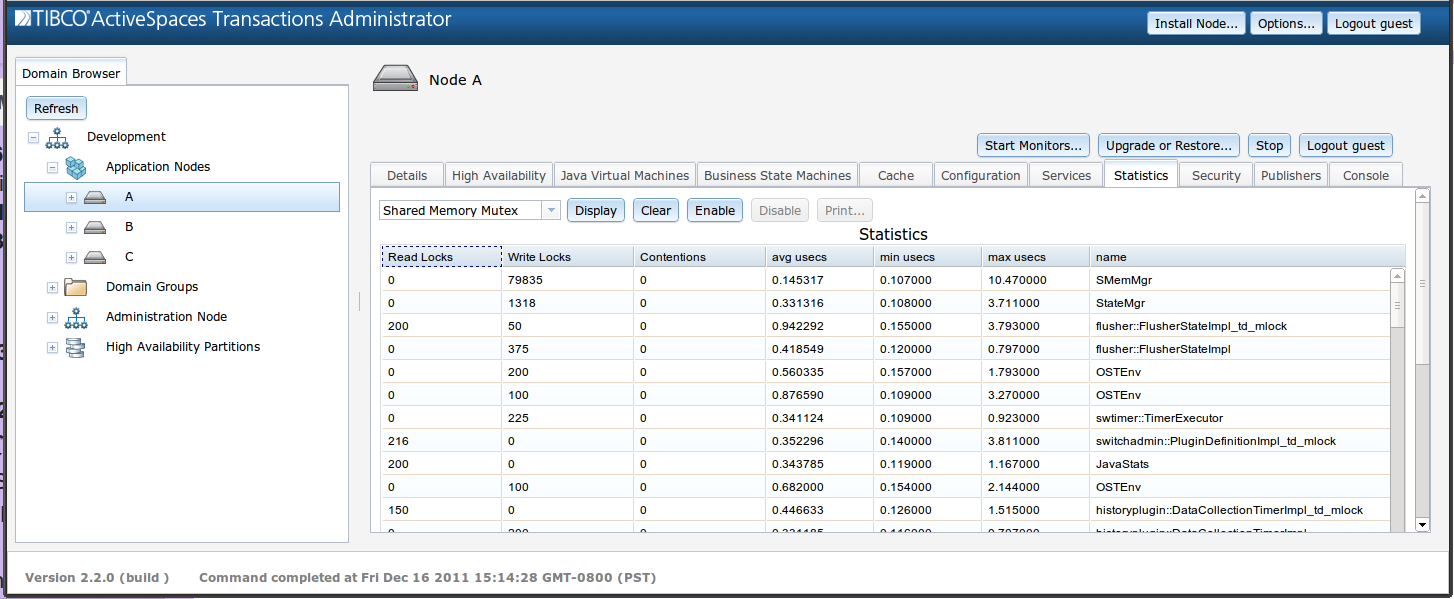
Display the collected statistics by clicking the
Display button:
Read Locks - The number of times the lock was locked for shared read access since the last clear of the statistic.
Write Locks - The number of times the lock was exclusively locked since the last clear of the statistic.
Contentions - The number of times that acquiring either a read or a write lock encountered contention since the last clear of the statistic.
avg usecs - The average number of microseconds taken to acquire the lock since the last clear of the statistic.
min usecs - The minimum number of microseconds taken to acquire the lock since the last clear of the statistic.
max usecs - The maximum number of microseconds taken to acquire the lock since the last clear of the statistic.
name - A label associating a particular mutex with its owner or function in the system.
A report showing process local mutex locking is available
by selecting Local Mutex in the pull down menu in the statistics
panel, and enabling collection by clicking the Enable
button.
The collection of mutex locking statistics imposes a slight
performance penalty and is not enabled by default.
These statistics are available for running JVMs and system processes.
Note that local mutex statistics report on low level runtime synchronization primitives that are not directly exposed to or manipulated by application code.
Allow the data to collect for several seconds or more, and then
disable statistics collection by clicking the
Disable button.
Disabling the statistics collection removes the slight performance
penalty and allows the system to run at full speed.
Disabling the statistics collection does not remove the collected statistics.
Display the collected statistics by clicking the
Display button:
Read Locks - The number of times the lock was locked for shared read access since the last clear of the statistic.
Write Locks - The number of times the lock was exclusively locked since the last clear of the statistic.
Contentions - The number of times that acquiring either a read or a write lock encountered contention since the last clear of the statistic.
avg usecs - The average number of microseconds taken to acquire the lock since the last clear of the statistic.
min usecs - The minimum number of microseconds taken to acquire the lock since the last clear of the statistic.
max usecs - The maximum number of microseconds taken to acquire the lock since the last clear of the statistic.
name - A label associating a particular mutex with its owner or function in the system. The value is prefixed with the name of the process or JVM which contains the mutex.
The runtime uses a shared memory based interprocess communication mechanism for a within-node RPC mechanism, and also for managing the life cycle of asynchronous method calls.
These statistics are available while the node is running.
Method Type - Synchronous or Asynchronous.
Sent - The number of method invocations.
Completed - The number of method invocations that have completed execution.
Difference - The difference between the number of invocations, and the number of completed invocations. For asynchronous methods, this can show queuing.
Dropped - The number of queued method invocations which were dropped because the target object had been destroyed.
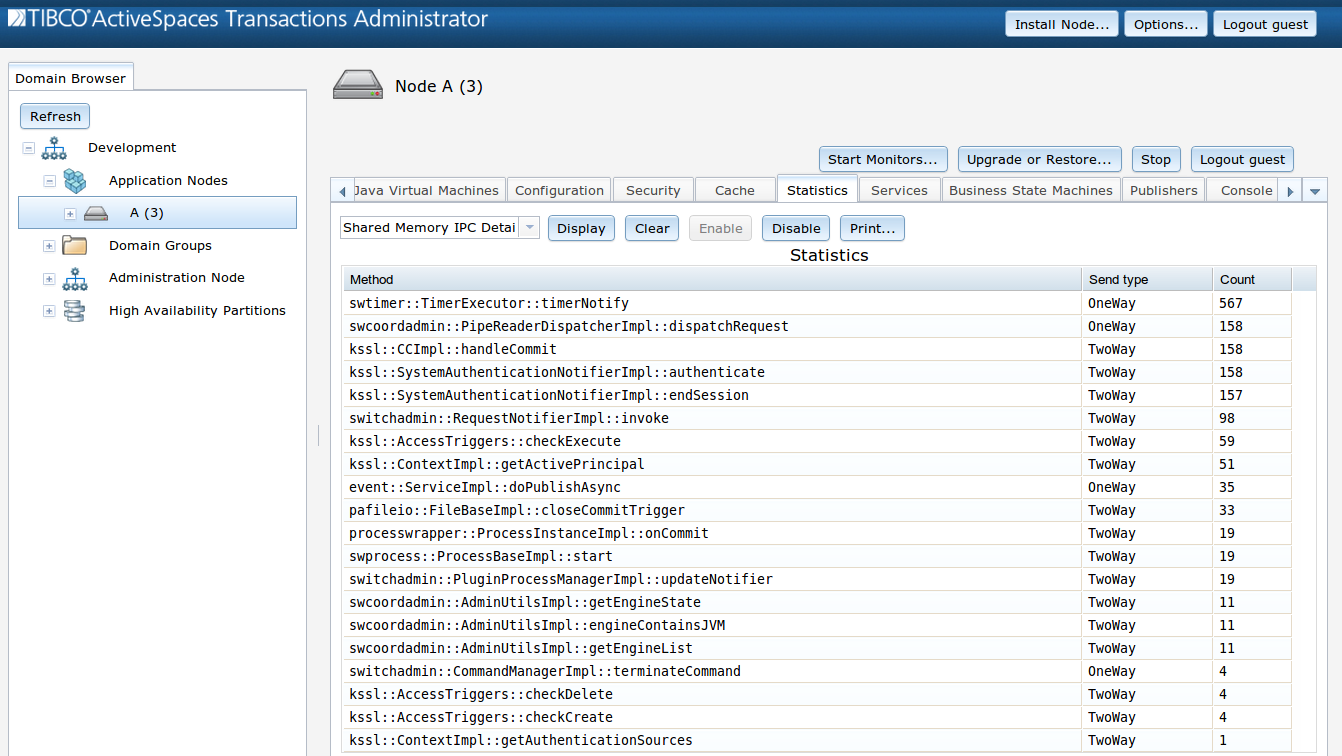
Finer grained shared memory IPC statistics, showing each of the methods invoked within a node are also available. The collection of these statistics imposes a slight performance penalty and consumes shared memory for each method invocation, and is not enabled by default.
These statistics are available while the node is running.
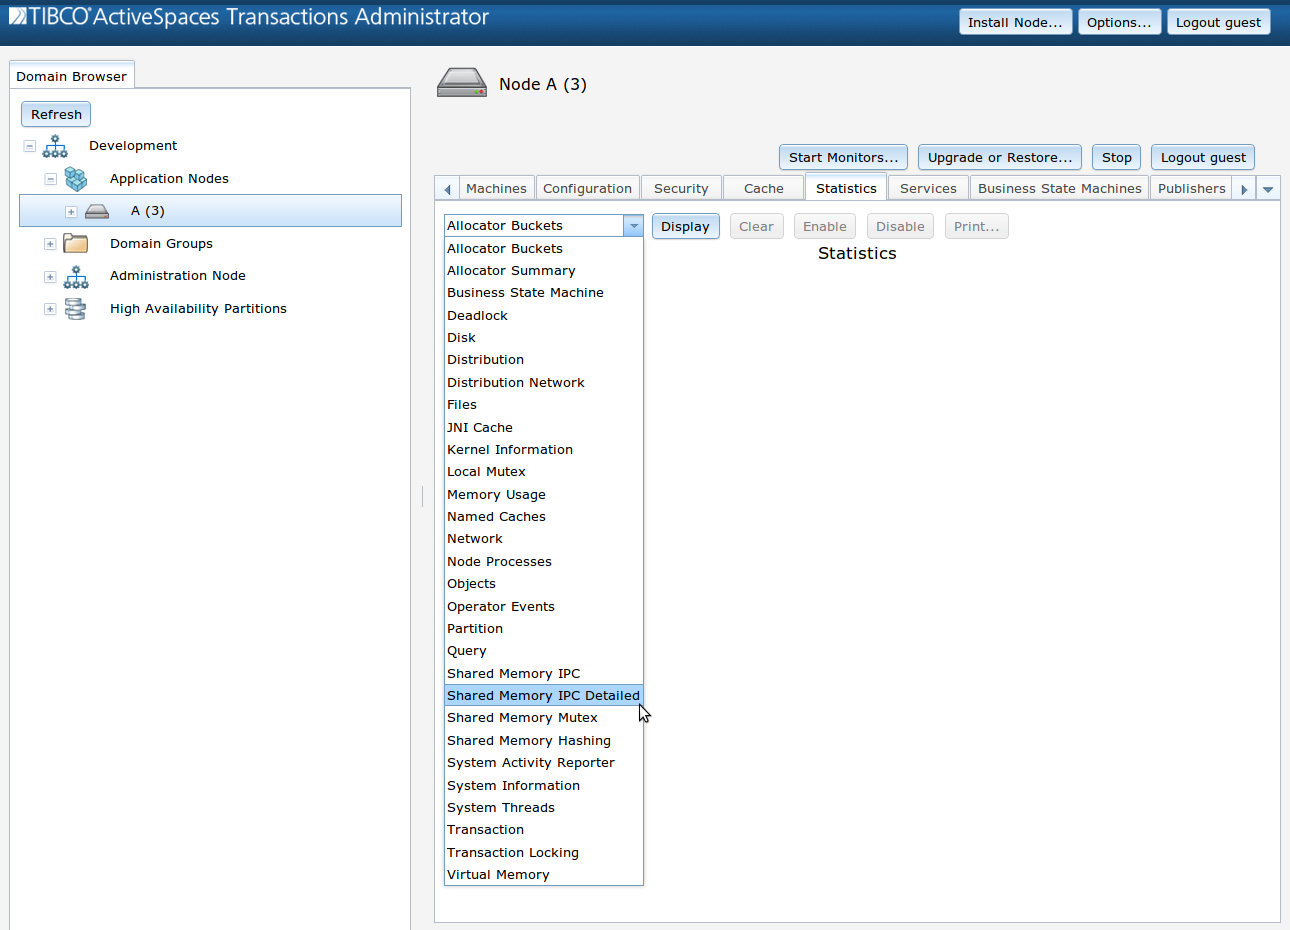
To collect these statistics, select Shared Memory IPC Detailed in the pull down menu in the statistics panel:
Next enable the collection of these statistics by clicking
the Enable button. After you have collected statistics
for a sufficient period of time press the Disable
button to stop the statistics collection. Pressing the Clear
button clears the currently collected statistics and reclaims the memory used
by the statistics collection.
The statistics may be displayed at any time by pressing the
Display button.
Method - The name of the method invoked via the shared memory IPC mechanism.
Send Type - Synchronous or Asynchronous.
Count - The number of method invocations.
Display information about the High Availability Partitions currently defined in the node.
These statistics are available if the node has been configurated for distribution and there is at least one JVM running.
Name - The name of the partition.
Role - Whether the partition active on this node, or is a replica.
Cardinality - The number of objects currently in the partition.
Creates - The number of times that an object was created in this partition since the last clear of the statistics. This statistic is not transactional.
Updates - The number of times that an object was modified in this partition since the last clear of the statistics. This statistic is not transactional.
Updates - The number of times that an object was deleted in this partition since the last clear of the statistics. This statistic is not transactional.
Remote Creates Discarded - The number of creates since the last clear of the statistics, that could not be sent to a remote node.
Remote Updates Discarded - The number of updates since the last clear of the statistics, that could not be sent to a remote node.
Remote Deletes Discarded - The number of deletes since the last clear of the statistics, that could not be sent to a remote node.
Async Creates Discarded - The number of asynchronous create failures that occurred in this partition since the last clear of the statistics.
Async Updates Discarded - The number of asynchronous update failures that occurred in this partition since the last clear of the statistics.
Async Deletes Discarded - The number of asynchronous delete failures that occurred in this partition since the last clear of the statistics.
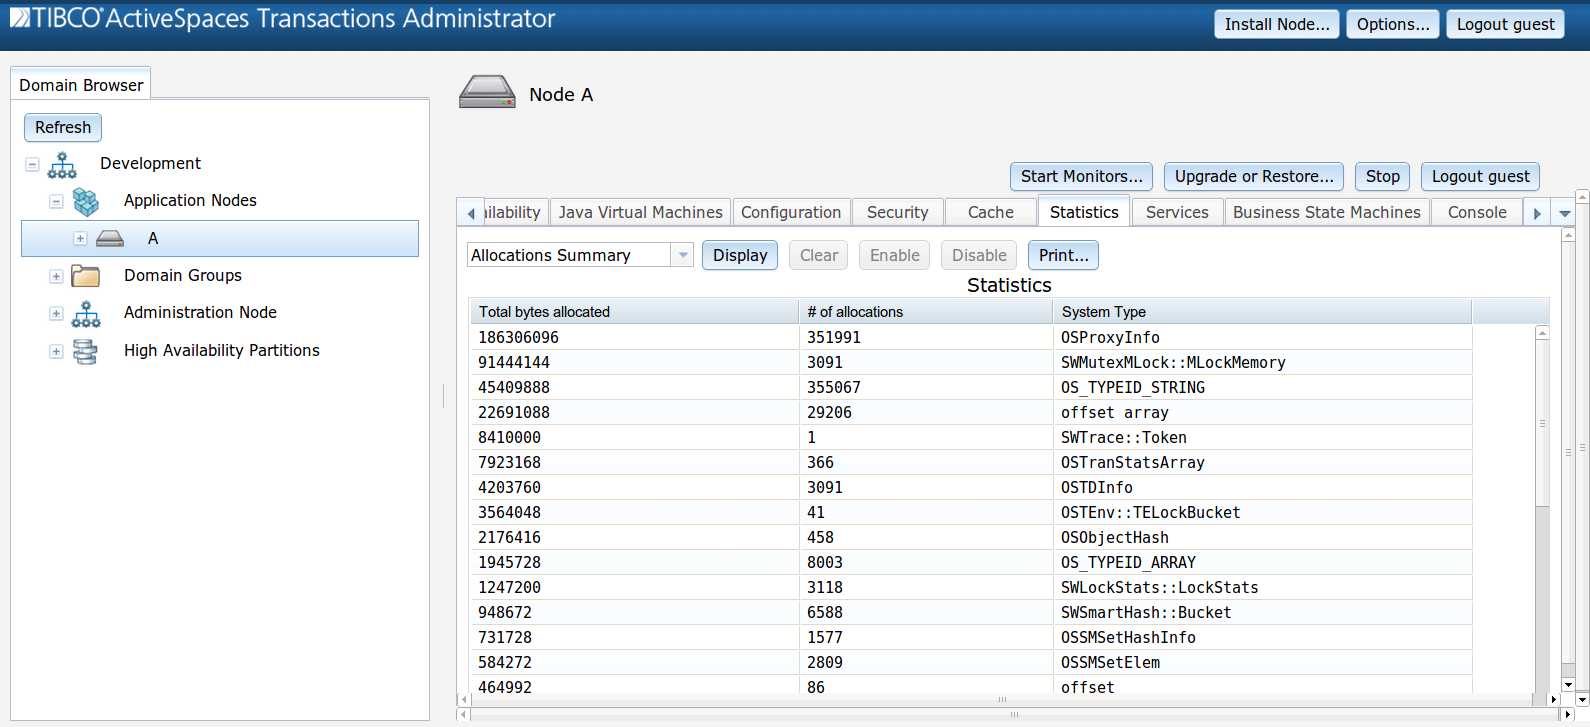
A report of all system shared memory allocations can be found in the Allocations Summary.
These statistics are available while the node is running.
Total bytes allocated - the total size, in bytes, of all current allocations of this system type.
# of allocations - the total number of allocations of this system type.
System Type - the system type allocated.
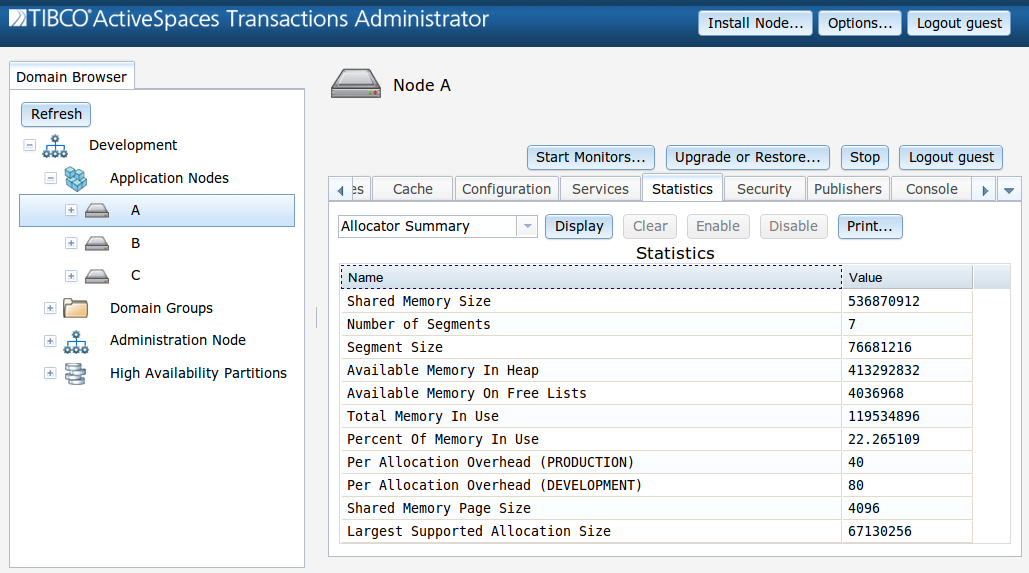
General details about the shared memory allocator can be found in the Allocator Summary report
These statistics are available while the node is running.
Shared Memory Size - the size, in bytes, of the node's shared memory.
Number of Segments - the number of segments (degree of parallelism) in the unallocated heap.
Segment Size - the initial size, in bytes, of each segment within the unallocated heap.
Available Memory In Heap - the amount, in bytes, of shared memory that has not yet been used by the node.
See the following Shared Memory Allocator Buckets Report section for details about the organization of the shared memory allocator.
Available Memory On Freelists - the amount, in bytes, of node shared memory that has already been allocated and deallocated, and is now available on the freelist.
See the following Shared Memory Allocator Buckets Report section for details about the organization of the shared memory allocator.
Total Memory In Use - the amount, in bytes, of shared memory that is currently in use on the node.
Percent Of Memory In Use - Total Memory In Use shown as a percentage of Shared Memory Size.
Per Allocation Overhead (PRODUCTION) - The amount, in bytes, of shared memory allocation bookkeeping per allocation, for a node running with with a PRODUCTION build.
Per Allocation Overhead (DEVELOPMENT) - The amount, in bytes, of shared memory allocation bookkeeping per allocation, for a node running with with a DEVELOPMENT build.
Shared Memory Page Size - Not currently used.
Largest Supported Allocation Size - The largest individual shared memory allocation size, in bytes, supported on this node.
In a freshly started node, all shared memory starts in the shared memory heap. When shared memory is first allocated, it taken from the heap. When shared memory is freed, it is put on a freelist, organized allocation size. Subsequent allocations will first attempt to find memory on the freelist.
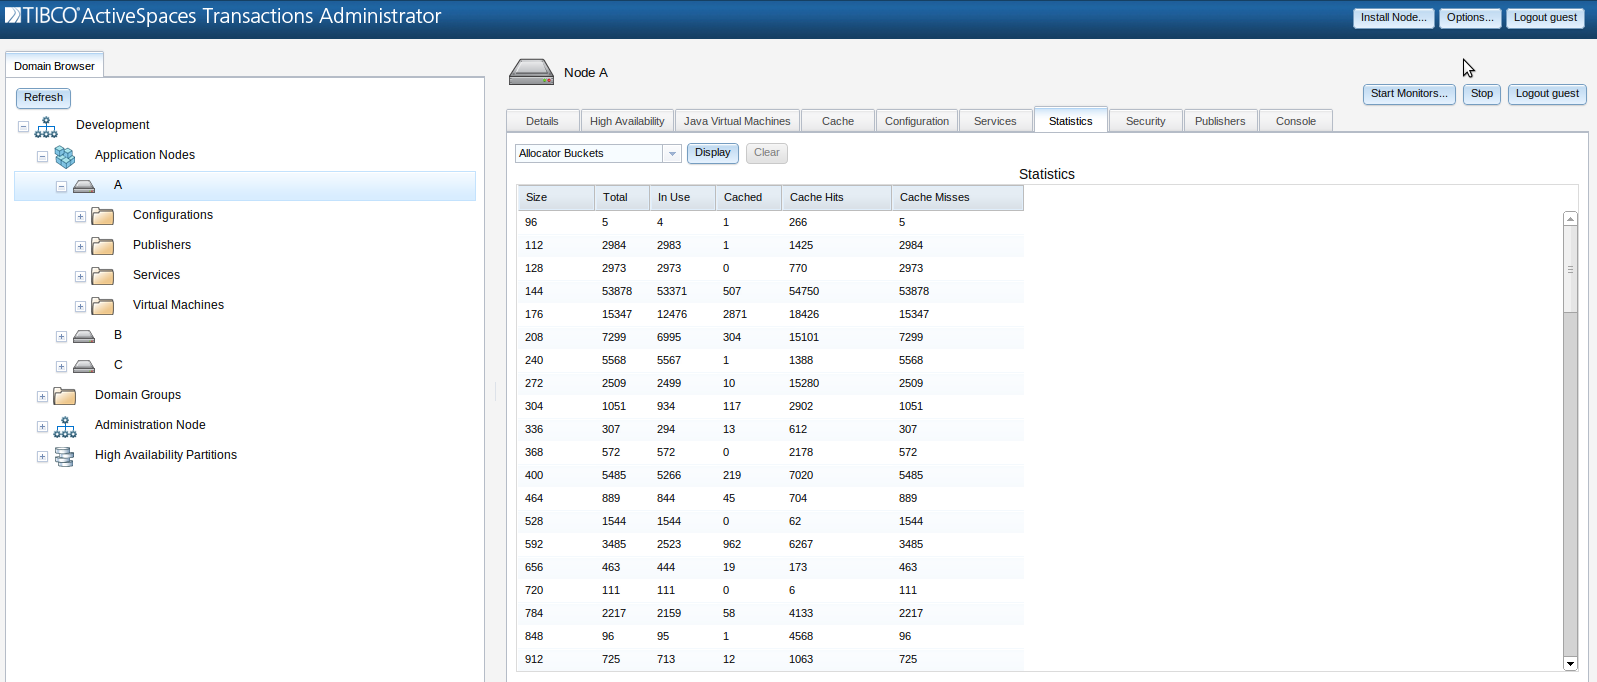
Detailed information about the current state of shared memory allocations and freelists may be found in the allocator buckets report
These statistics are available while the node is running.
Size - the number of bytes for this allocation bucket.
Total - the number of allocations of this size that have been taken from the shared memory heap.
In Use - the number of allocations of this size currently in use.
Cached - the number of allocations of this size that are currently on the freelist.
Cache Hits - the number of times an allocation request for this size was made and filled from the freelist.
Cache Misses - the number of times an allocation request for this size was filled from the shared memory heap.
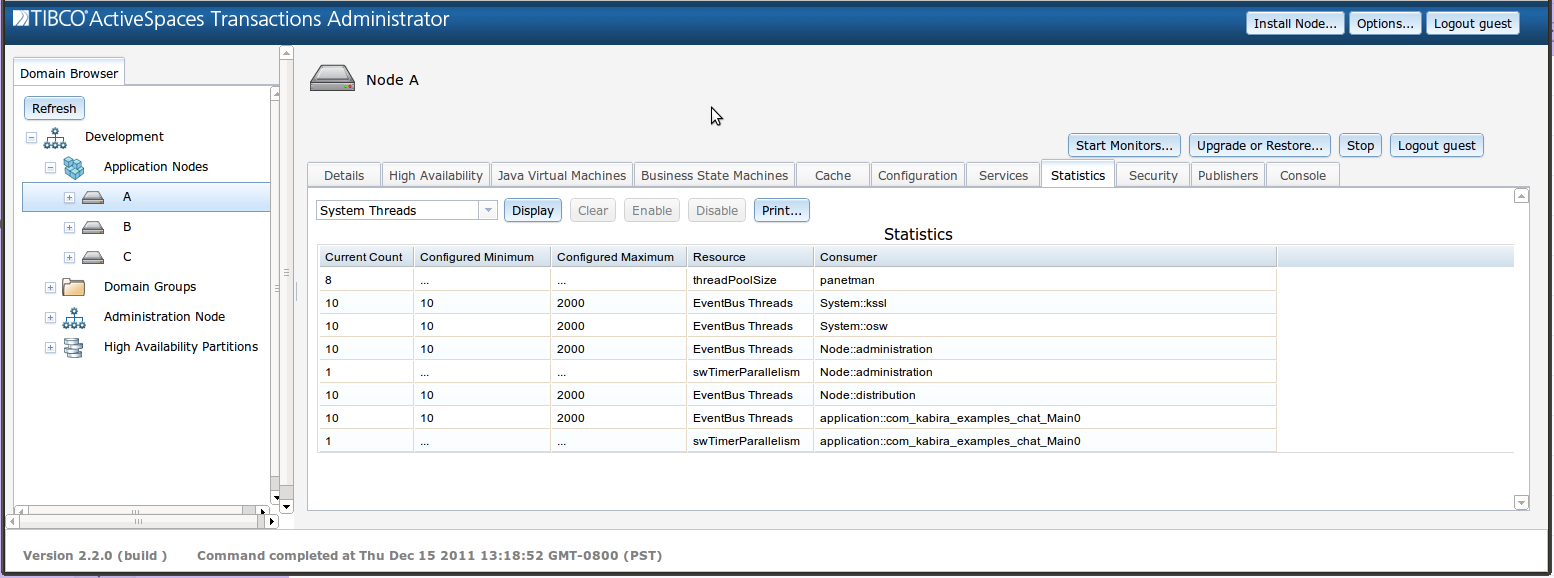
Display information about system threads within the node.
These statistics are for all running JVMs and system processes.
Current Count - The number of threads that currently exist.
Configured Minimum - The configured value for the minimum number of this type of system thread.
Configured Maximum - The configured value for the maximum number of this type of system thread.
Resource - The system resource associated with this thread.
Consumer - The process or system component associated with this thread resource.
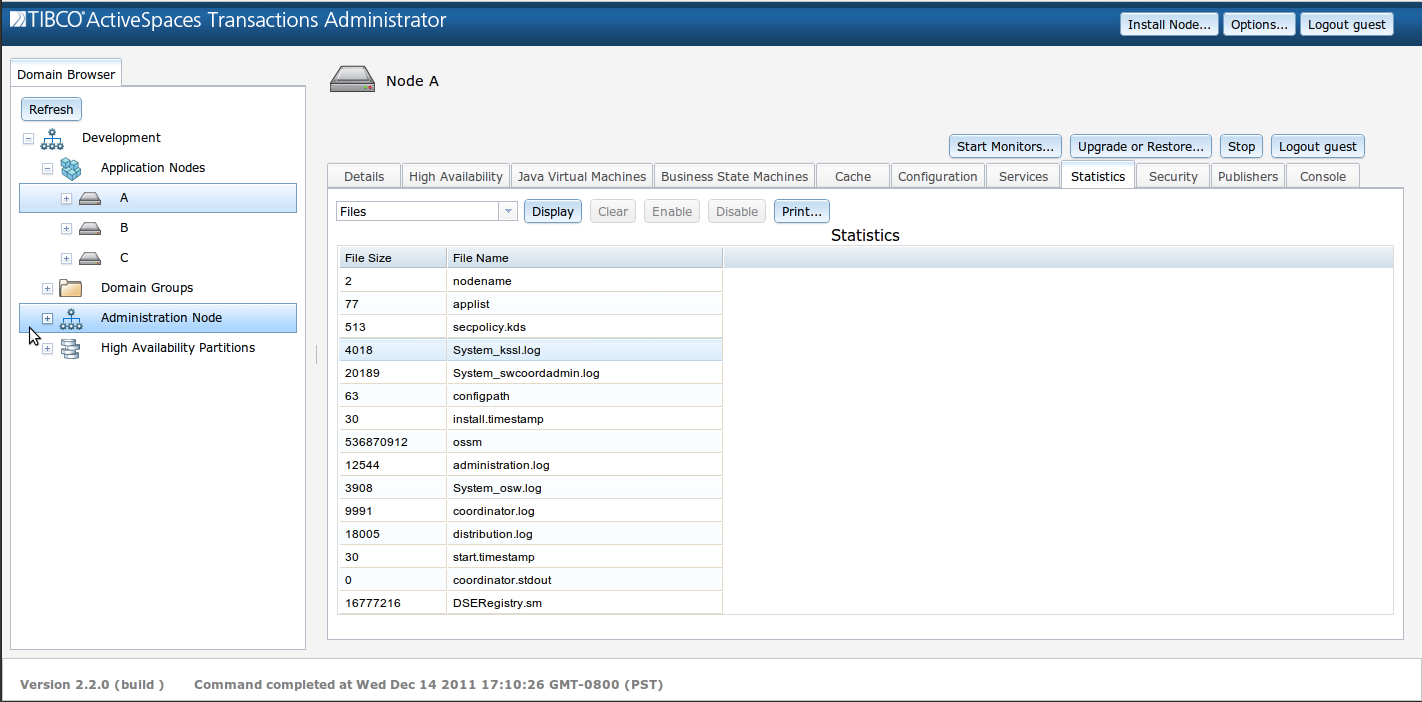
Display the files in the node directory, and their sizes in bytes.
These statistics are available while the node is running.
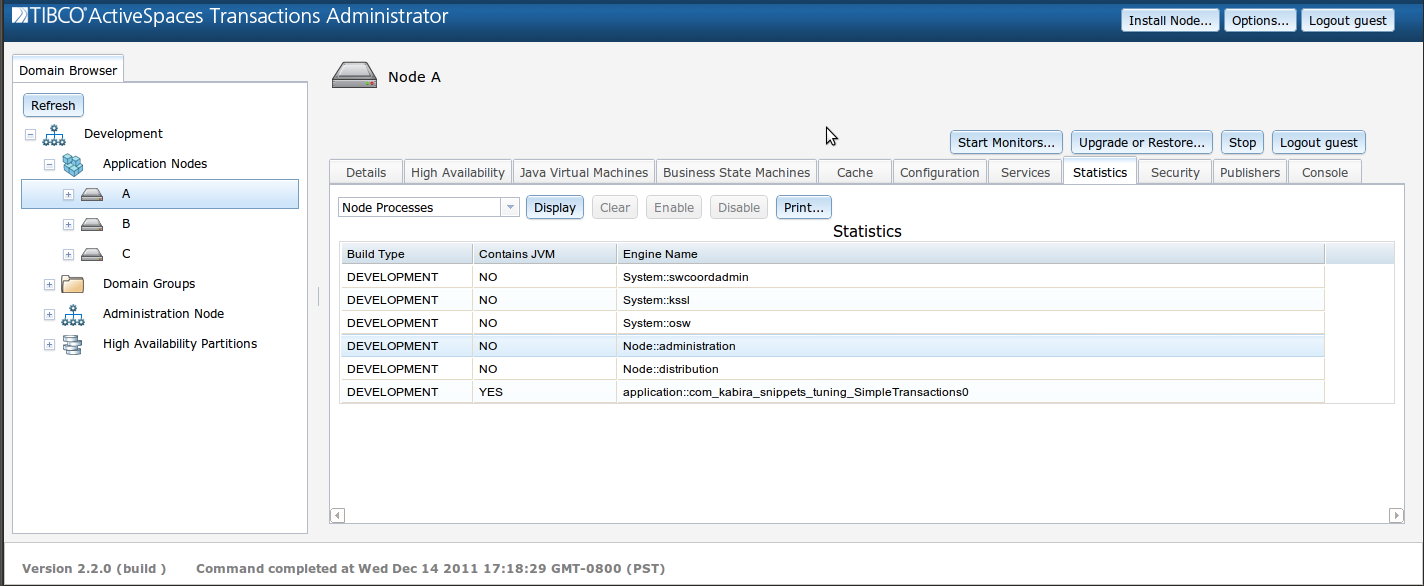
Display a list of the application, node, and system processes running on the node.
These statistics are available while the node is running.
Build Type - Whether the process contains PRODUCTION binaries or DEVELOPMENT (debug) binaries.
Contains JVM - Whether or not this process contains a Java VM.
Process Name - The name of the process.
State information about the ActiveSpaces® Transactions
distribution layer is available by selecting
Distribution in the pull down menu
in the statistics panel.
These statistics are available if the node has been configured for distribution and there is at least one JVM running.
Remote node - which other node in the cluster that this row of statistics refer to.
Remote location - the location code for the remote node.
Current state - this node's view of the current state of the remote node.
Remote network interfaces - the network interface devices used for connections with the remote node.
Create time - when the remote node was discovered by the current node.
Active transactions - the number of transactions with the remote node currently in progress.
Type mismatches - the number of types that are mismatched between the current node and the remote node.
Global transaction commits - the total number of distributed transactions started and committed on the current node that involved the remote node. Clear resets this counter to 0.
Global transaction aborts - the total number of distributed transactions started and aborted on the current node that involved the remote node. Clear resets this counter to 0.
Implicit transaction commits - the total number of distributed transactions started and committed by the remote node that involved the current node. Clear resets this counter to 0.
Implicit transaction aborts - the total number of distributed transactions started and aborted by then remote node that involved the current node. Clear resets this counter to 0.
Number of keepalives received - the total number of internal keepalive messages received from the remote node. Clear resets this counter to 0.
Number of keepalives sent - the total number of internal keepalive messages sent from this node to the remote node. Clear resets this counter to 0.
Number of connects - the number of successful connections from this node to the remote node. Clear resets this counter to 0.
Number of logins - the number of successful logins from the remote node to this node. Clear resets this counter to 0.
Number of connect failures - the number of unsuccessful connections from this node to the remote node. Clear resets this counter to 0.
Number of login failures - the number of unsuccessful logins from the remote node to this node. Clear resets this counter to 0.
Number of send failures - the number of failed attempts to send data from this node to the remote node. Clear resets this counter to 0.
Number of read failures - the number of failed attempts to read data from the remote node. Clear resets this counter to 0.
Number of deferred failures - the number of failures attempting to write data to a failed remote node. Clear resets this counter to 0.
Number of async failures - the number of failures attempting to replica asynchronous data to a failed remote node. Clear resets this counter to 0.
Network usage statistics by the ActiveSpaces® Transactions
distribution layer are available by selecting
Distribution Network in the pull down menu
in the statistics panel.
The collection of network usage statistics imposes a slight
performance penalty and is not enabled by default.
These statistics are available while the node is running.
To enable, click Enable.
Allow the data to collect for the desired amount of time
and then disable the collection by clicking the
Disable button.
Disabling network statistics collection does not clear the collecting data.
Display the collected statistics by clicking the
Display button.
Node - the name of the remote node that this channel (socket) is connected to.
Channel - the name of the channel (socket).
Channel type - the type of the channel (read or write).
Connect time - when this channel's connection was established.
Number reads - the total number of read calls on this channel. Clear resets this count to 0.
Number writes - the total number of write calls on this channel. Clear resets this count to 0.
Bytes read - the total number of bytes read from this channel. Clear resets this count to 0.
Bytes written - the total number of bytes written to this channel. Clear resets this count to 0.
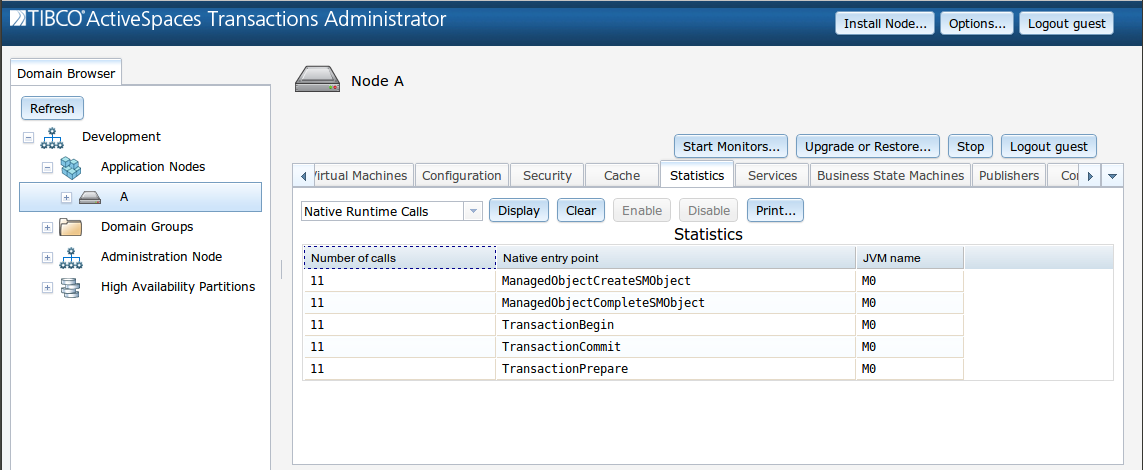
Show per-JVM information about native calls being made across JNI into the runtime.
These statistics are available for all running JVMS in the node.
Number of calls - Number of calls made since the last time this statistic was cleared.
Native entry point - Name of the runtime native entry point.
JVM name - Name of the JVM.
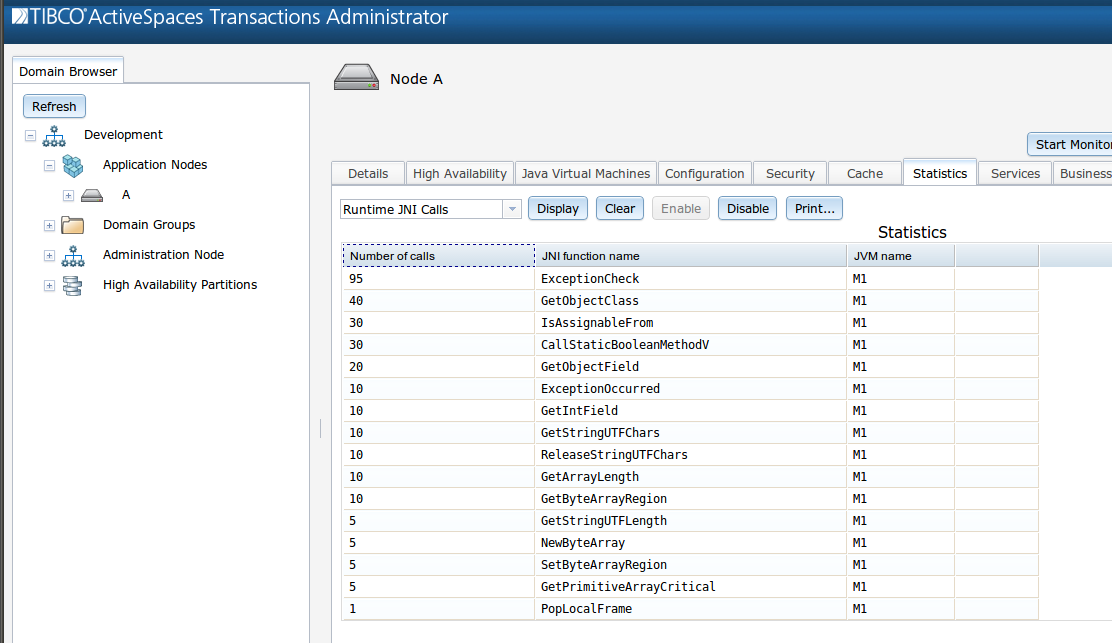
A report showing per-JVM information about JNI calls being
made from the runtime into the JVM is available by selecting
Runtime JNI Calls in the pull down menu in the statistics
panel, and enabling collection by clicking the Enable
button.
The collection of runtime JNI statistics imposes a
performance penalty and is not enabled by default.
These statistics are available for all running JVMS in the node.
Number of calls - Number of calls made since the last time this statistic was cleared.
JNI function name - Name of the JNI function.
JVM name - Name of the JVM.
Show information about the per-thread JNI caching done by the runtime for each JVM in the node.
These statistics are available for running JVMs and system processes.
Thread Type - Shows whether the thread is a Java thread or a runtime thread.
% Current - Current number of threads that have cached JNI resources.
% Allocations - Number of JNI cache resource allocations that have been done since the last time this statistic was cleared.
% Frees - Number of JNI cache resource deallocations that have been done since the last time this statistic was cleared.
% JVM - The JVM that the resources are being cached for.
